 12
12peptides
spectra
0.000 | 0.000
0.089 | 0.106
0.000 | 0.000
0.031 | 0.058
0.150 | 0.177
0.000 | 0.000
0.684 | 0.697
0.000 | 0.000
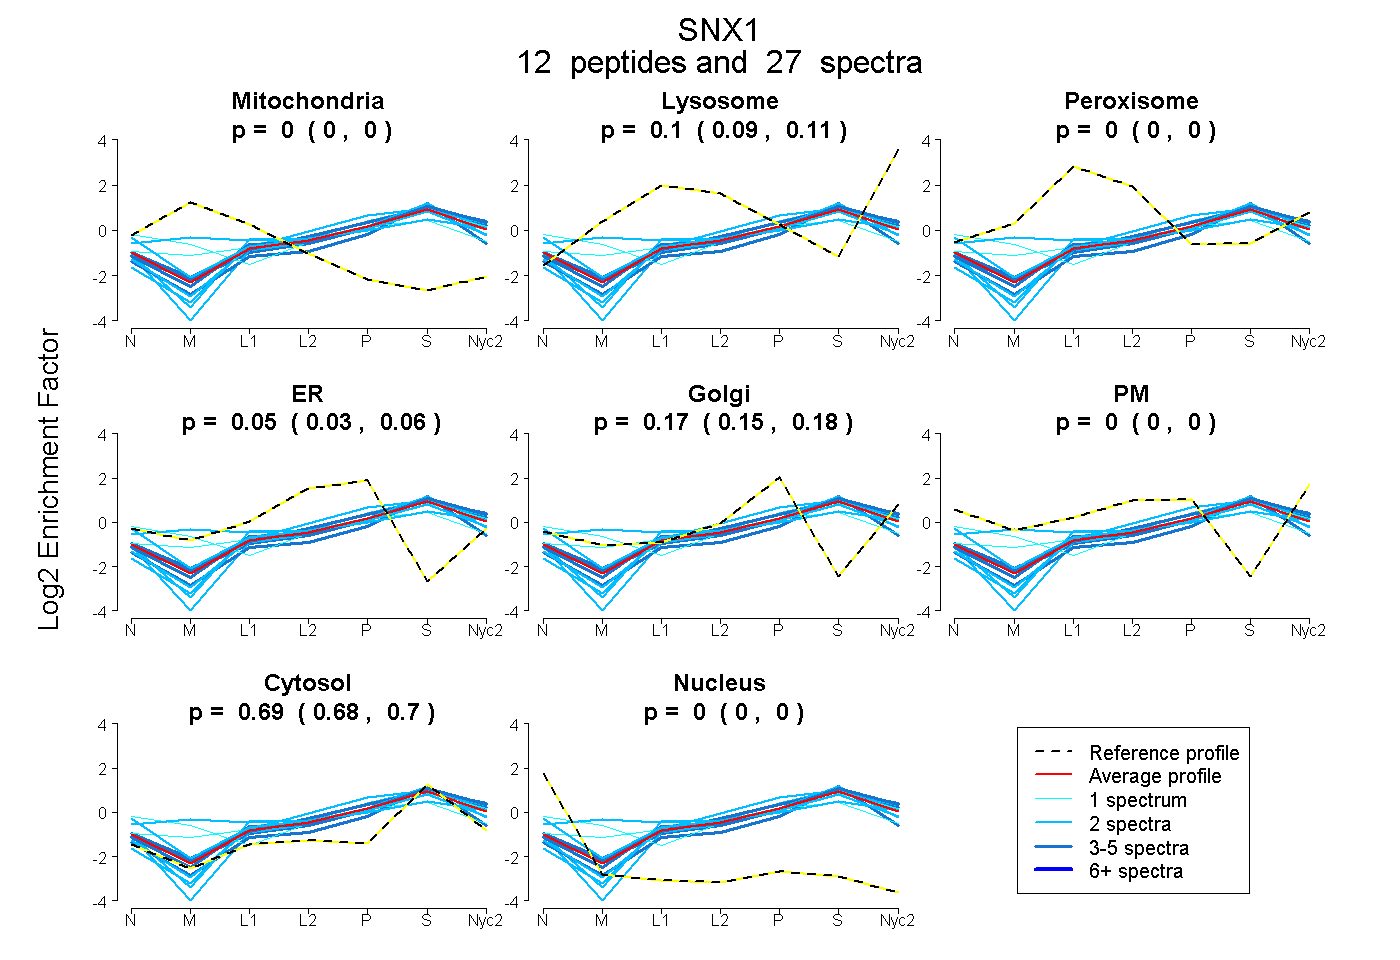
| Plot | Mito | Lyso | Perox | ER | Golgi | PM | Cytosol | Nucleus | |||||
| Expt A |
12 peptides |
27 spectra |
|
0.000 0.000 | 0.000 |
0.099 0.089 | 0.106 |
0.000 0.000 | 0.000 |
0.045 0.031 | 0.058 |
0.165 0.150 | 0.177 |
0.000 0.000 | 0.000 |
0.691 0.684 | 0.697 |
0.000 0.000 | 0.000 |
| 3 spectra, ILALVR | 0.000 | 0.149 | 0.000 | 0.000 | 0.216 | 0.000 | 0.635 | 0.000 | ||
| 2 spectra, YWEAFLPEAR | 0.053 | 0.055 | 0.195 | 0.000 | 0.196 | 0.033 | 0.467 | 0.000 | ||
| 2 spectra, AVGTQALSGAGLLK | 0.000 | 0.097 | 0.000 | 0.048 | 0.143 | 0.000 | 0.712 | 0.000 | ||
| 3 spectra, LQEVECEEQR | 0.000 | 0.000 | 0.000 | 0.029 | 0.121 | 0.000 | 0.850 | 0.000 | ||
| 1 spectrum, VTQYER | 0.085 | 0.000 | 0.000 | 0.009 | 0.214 | 0.143 | 0.550 | 0.000 | ||
| 2 spectra, MNESDIWFEEK | 0.000 | 0.069 | 0.000 | 0.140 | 0.000 | 0.000 | 0.792 | 0.000 | ||
| 2 spectra, FSDFLGLYEK | 0.000 | 0.006 | 0.000 | 0.000 | 0.195 | 0.000 | 0.799 | 0.000 | ||
| 2 spectra, SLIGMTK | 0.000 | 0.106 | 0.000 | 0.066 | 0.173 | 0.000 | 0.655 | 0.000 | ||
| 1 spectrum, ISTVVR | 0.000 | 0.127 | 0.072 | 0.000 | 0.203 | 0.000 | 0.598 | 0.000 | ||
| 4 spectra, DEITEWESR | 0.000 | 0.115 | 0.000 | 0.000 | 0.177 | 0.000 | 0.707 | 0.000 | ||
| 3 spectra, VTTQTSLPMFR | 0.000 | 0.158 | 0.000 | 0.000 | 0.137 | 0.000 | 0.705 | 0.000 | ||
| 2 spectra, WQDAQATLQK | 0.000 | 0.000 | 0.026 | 0.087 | 0.000 | 0.210 | 0.676 | 0.000 |
| Plot | Mito | Lyso or Perox | ER | Golgi | PM | Cytosol | Nucleus | ||||||
| Expt B |
3 peptides |
3 spectra |
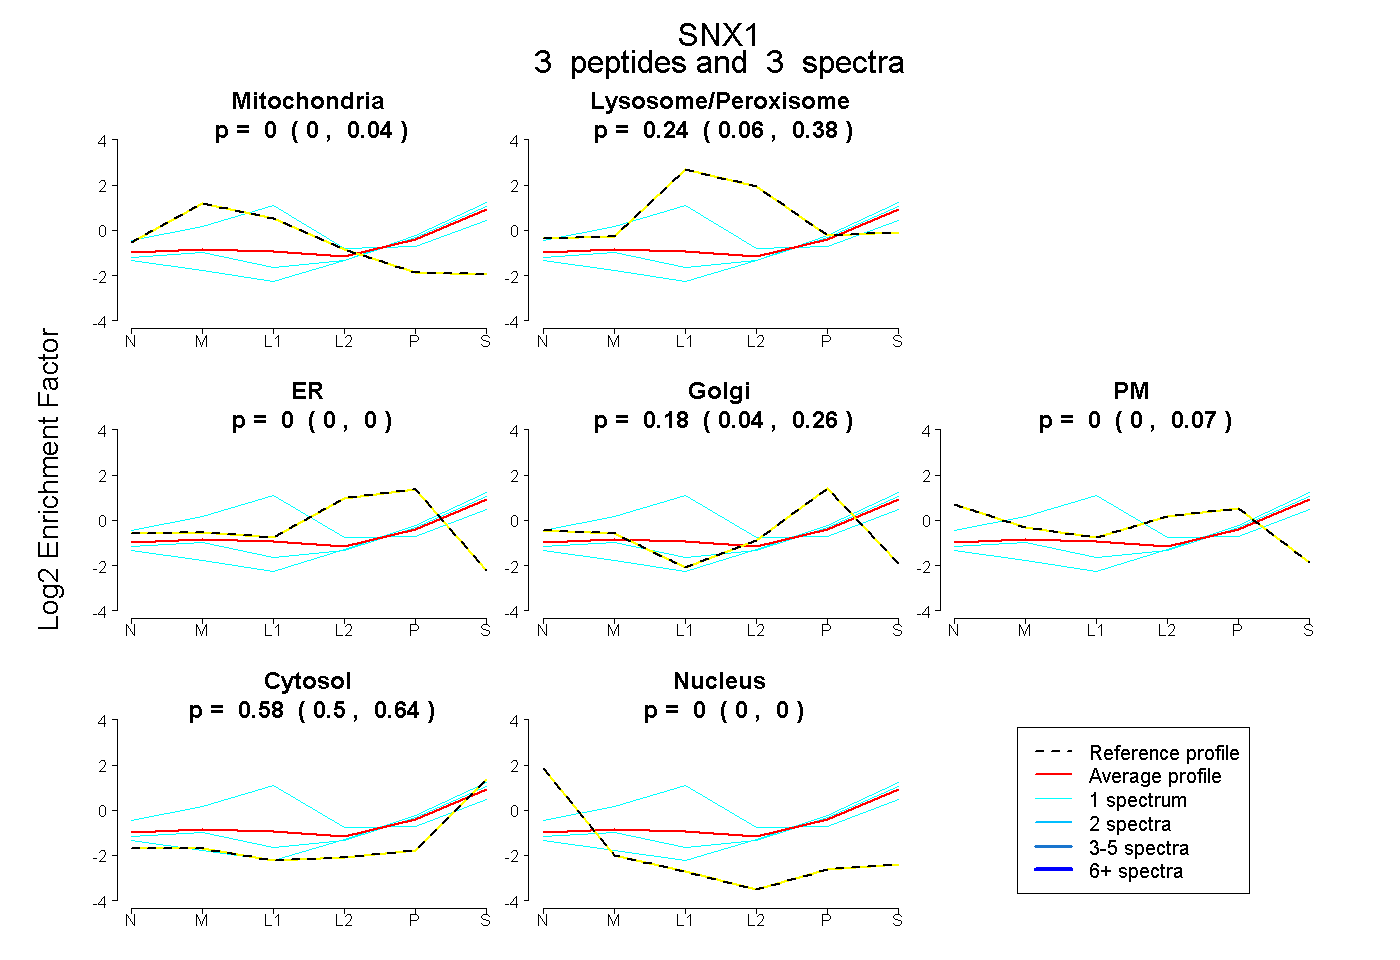 |
0.000 0.000 | 0.042 |
0.241 0.056 | 0.377 |
0.000 0.000 | 0.000 |
0.175 0.044 | 0.258 |
0.000 0.000 | 0.069 |
0.584 0.497 | 0.642 |
0.000 0.000 | 0.000 |
|||
| Plot | Lyso | Other | |||||||||||
| Expt C |
14 peptides |
46 spectra |
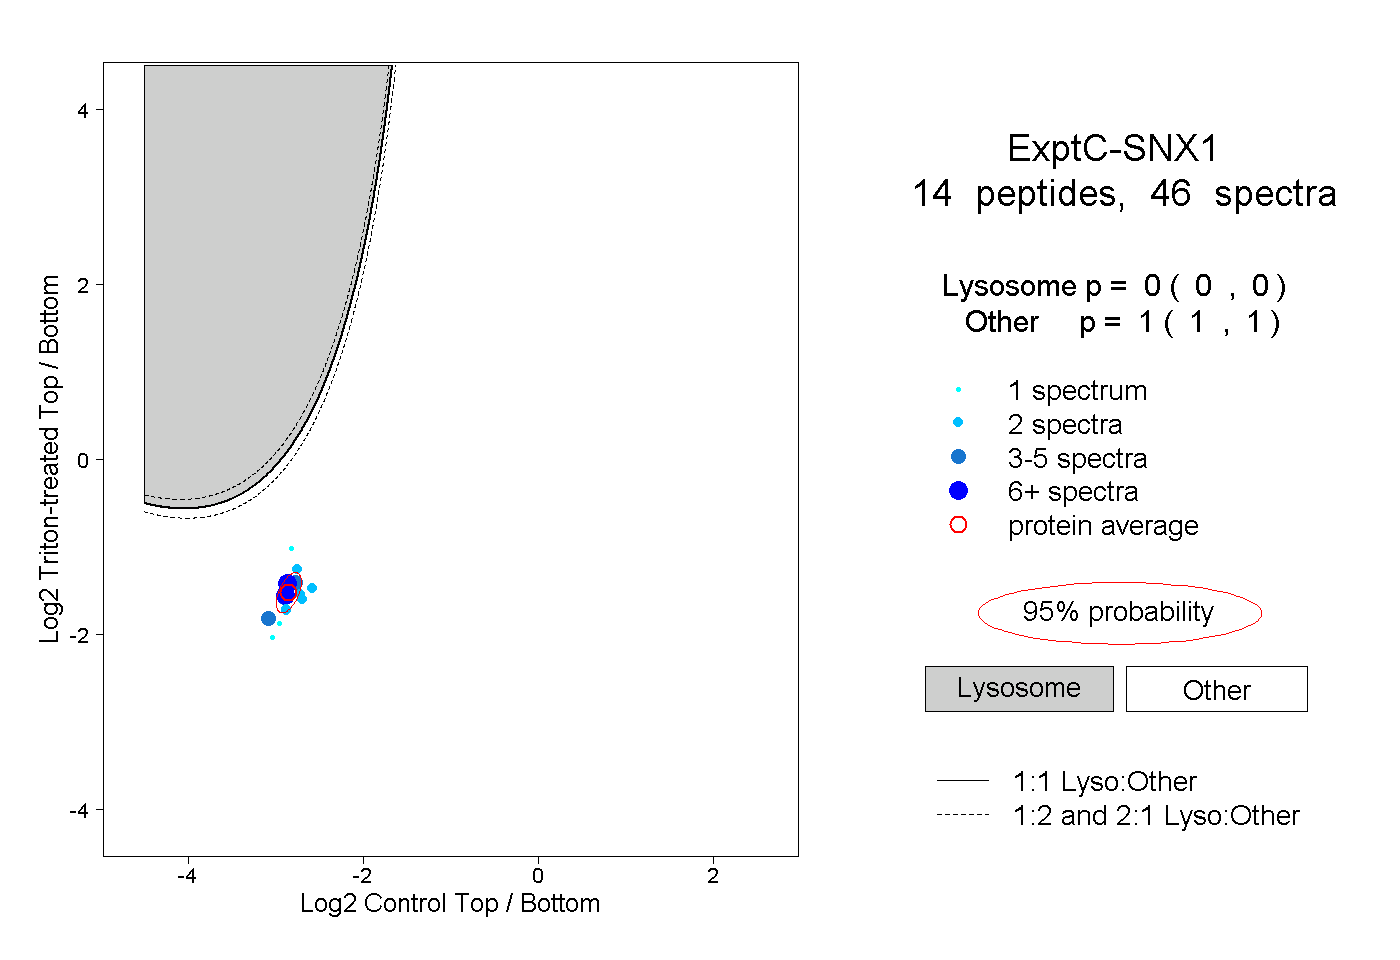 |
0.000 0.000 | 0.000 |
1.000 1.000 | 1.000 |
||||||||
| Plot | Lyso | Other | |||||||||||
| Expt D |
4 peptides |
5 spectra |
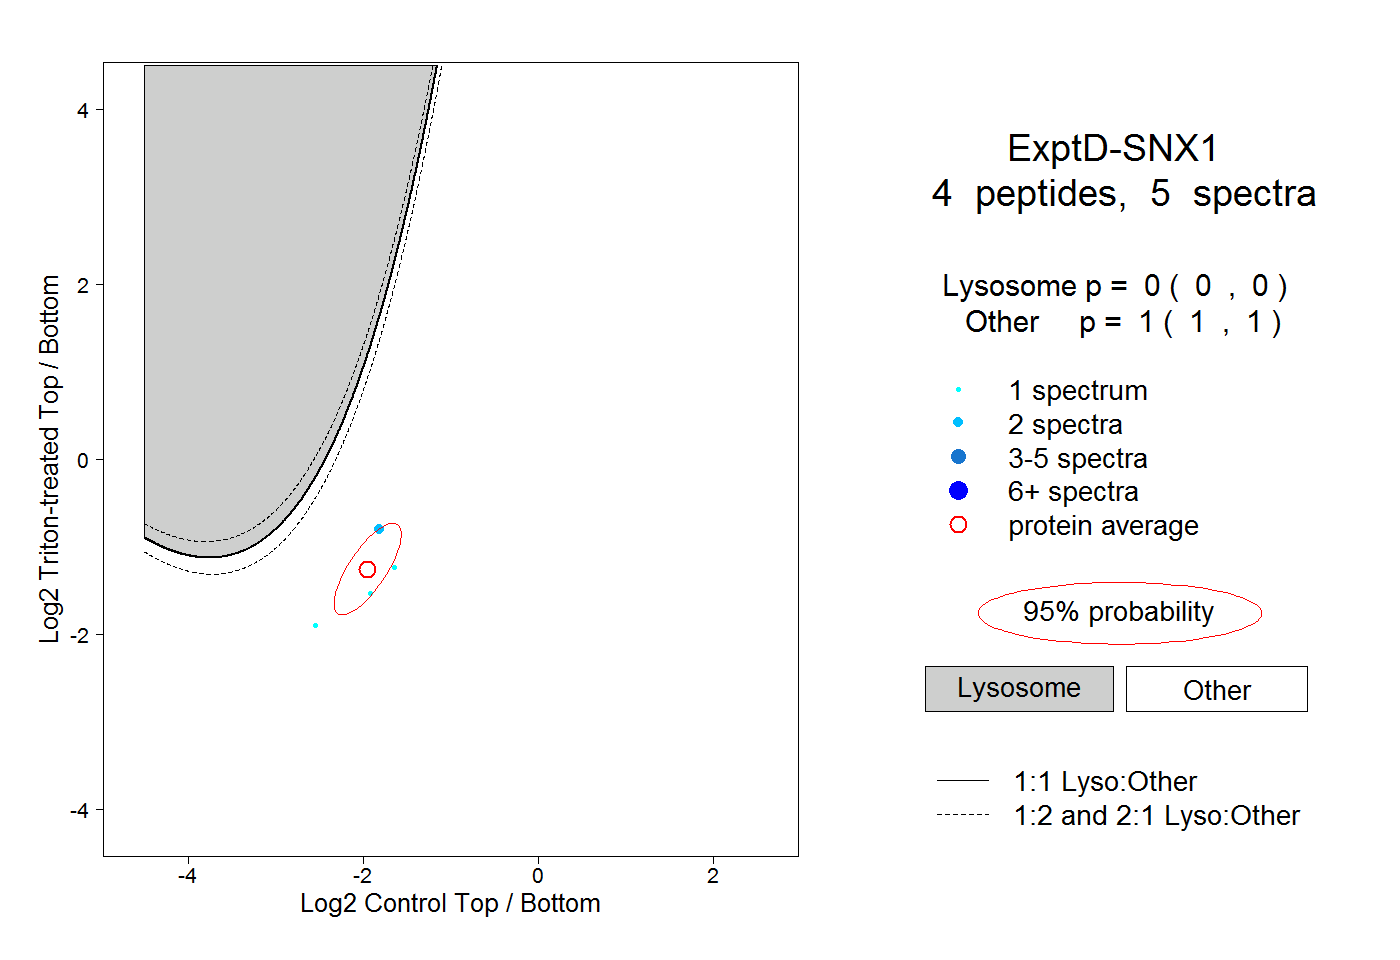 |
0.000 0.000 | 0.000 |
1.000 1.000 | 1.000 |