 4
4peptides
spectra
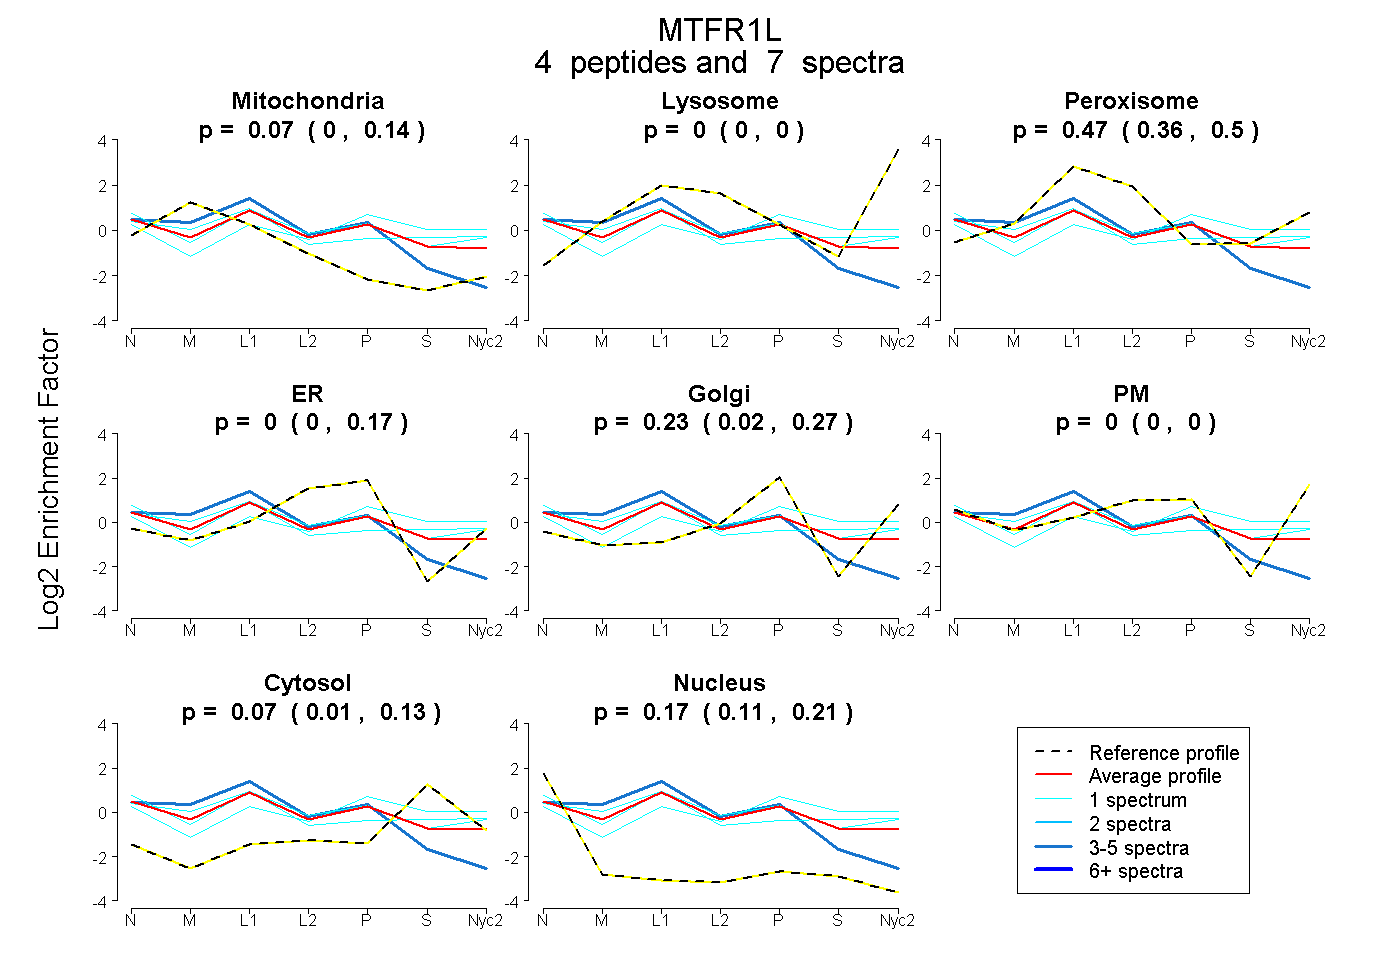
0.000 | 0.142
0.000 | 0.000
0.364 | 0.505
0.000 | 0.171
0.025 | 0.274
0.000 | 0.000
0.014 | 0.131
0.113 | 0.207
2peptides
spectra
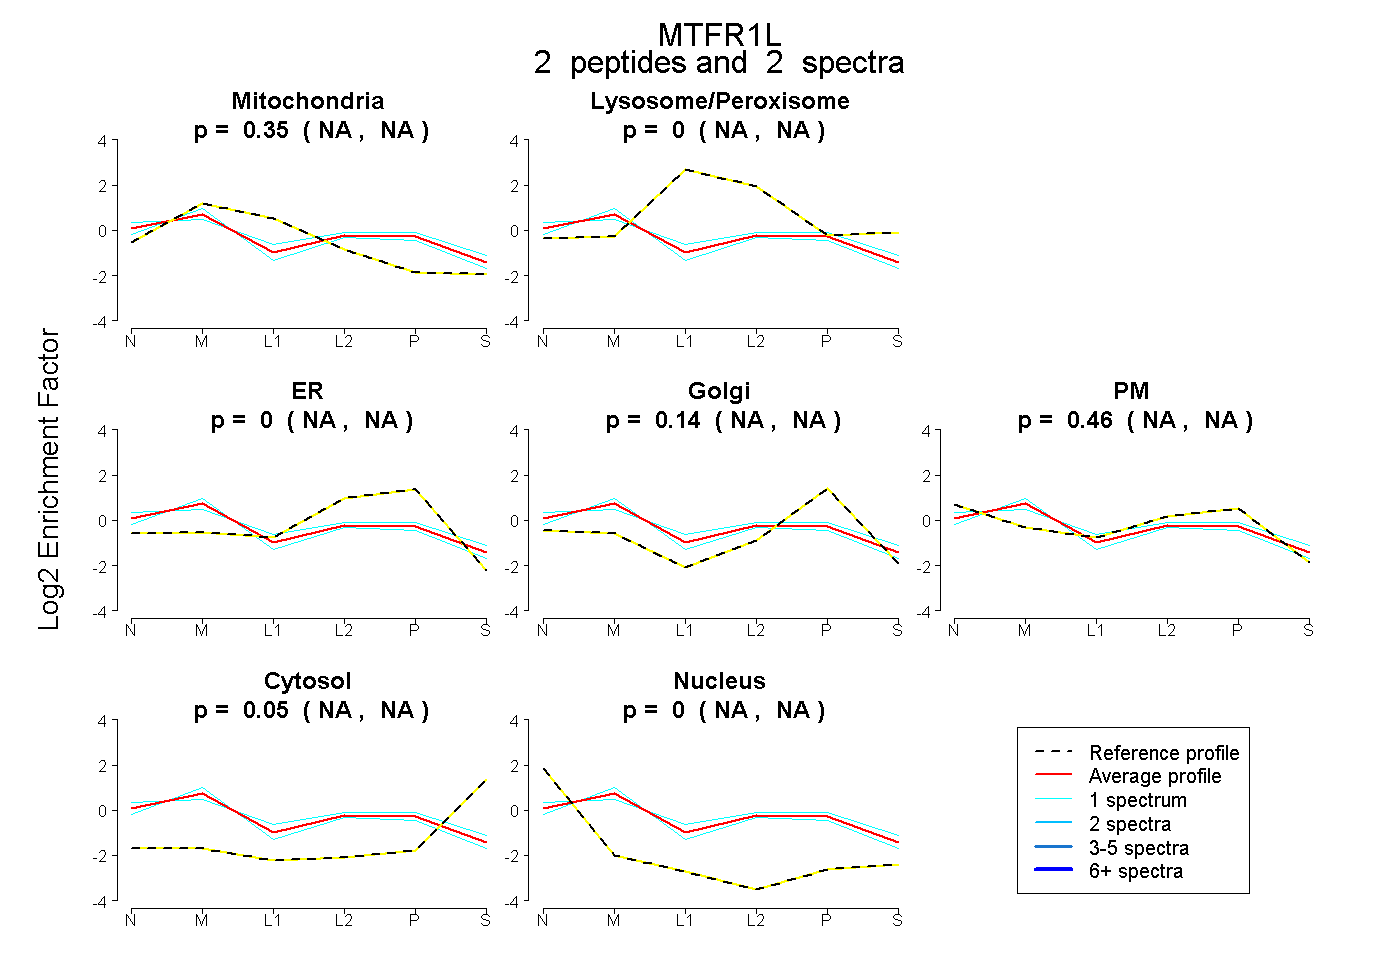
NA | NA
NA | NA
NA | NA
NA | NA
NA | NA
NA | NA
NA | NA
4peptides
spectra
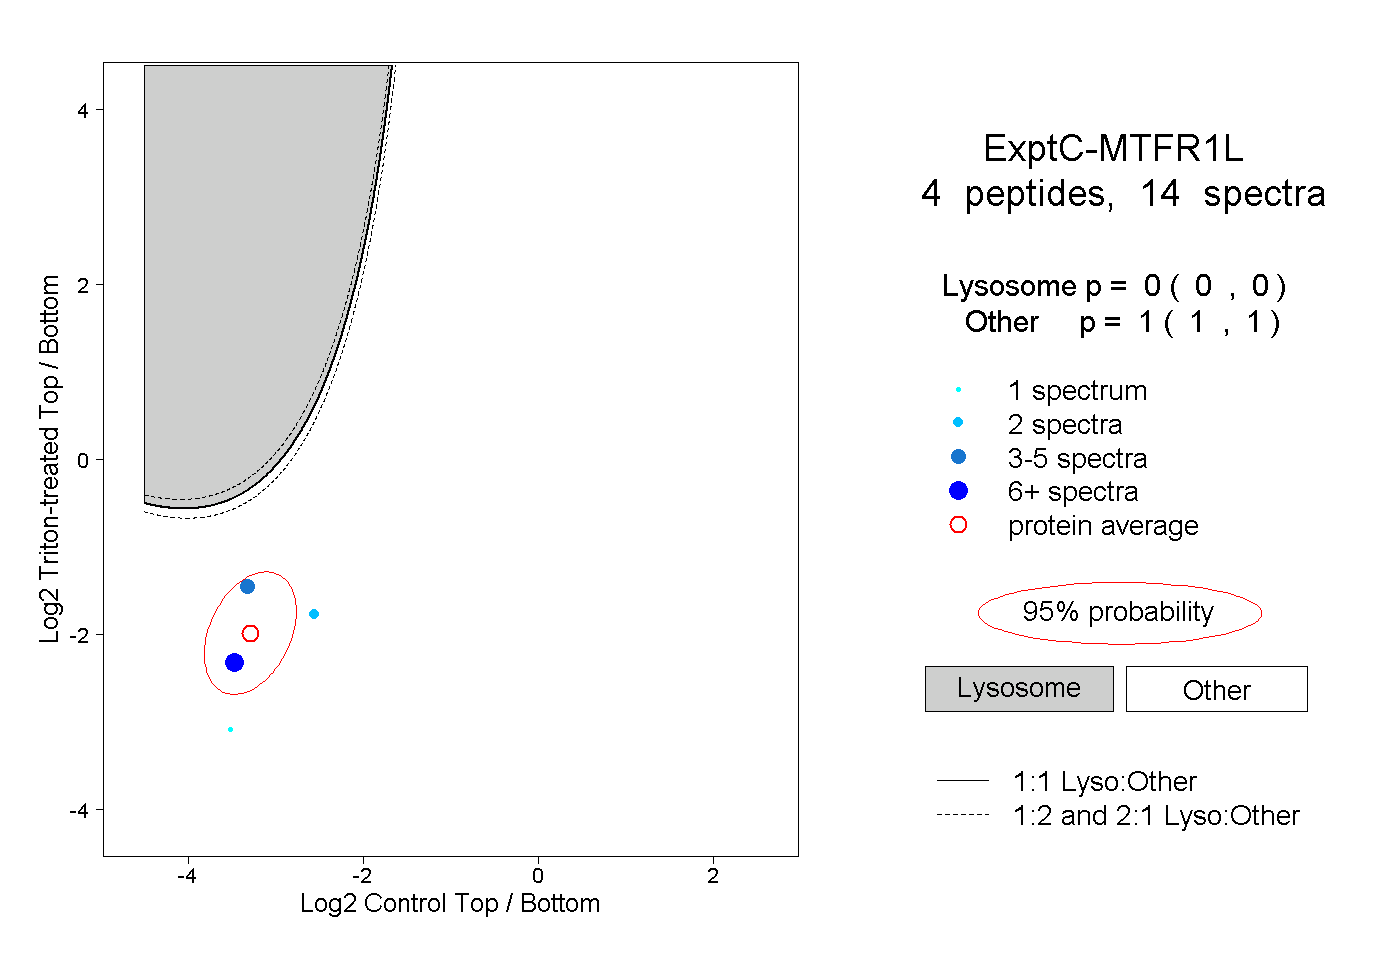
0.000 | 0.000
1.000 | 1.000