 4
4peptides
spectra
0.000 | 0.142
0.000 | 0.000
0.364 | 0.505
0.000 | 0.171
0.025 | 0.274
0.000 | 0.000
0.014 | 0.131
0.113 | 0.207
2peptides
spectra
NA | NA
NA | NA
NA | NA
NA | NA
NA | NA
NA | NA
NA | NA
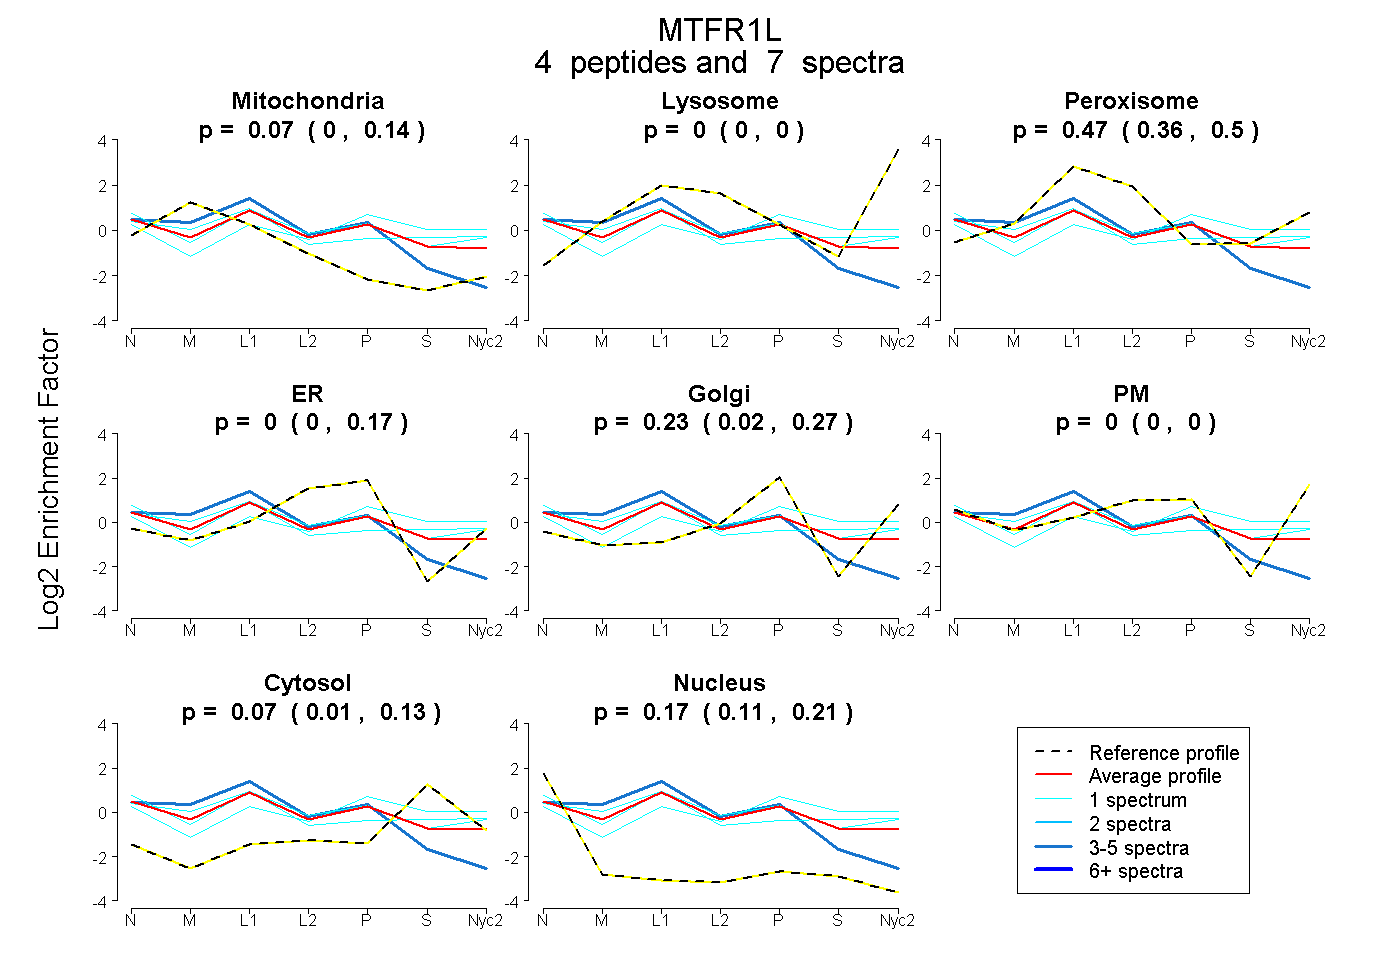
| Plot | Mito | Lyso | Perox | ER | Golgi | PM | Cytosol | Nucleus | |||||
| Expt A |
4 peptides |
7 spectra |
|
0.066 0.000 | 0.142 |
0.000 0.000 | 0.000 |
0.468 0.364 | 0.505 |
0.000 0.000 | 0.171 |
0.228 0.025 | 0.274 |
0.000 0.000 | 0.000 |
0.068 0.014 | 0.131 |
0.170 0.113 | 0.207 |
||
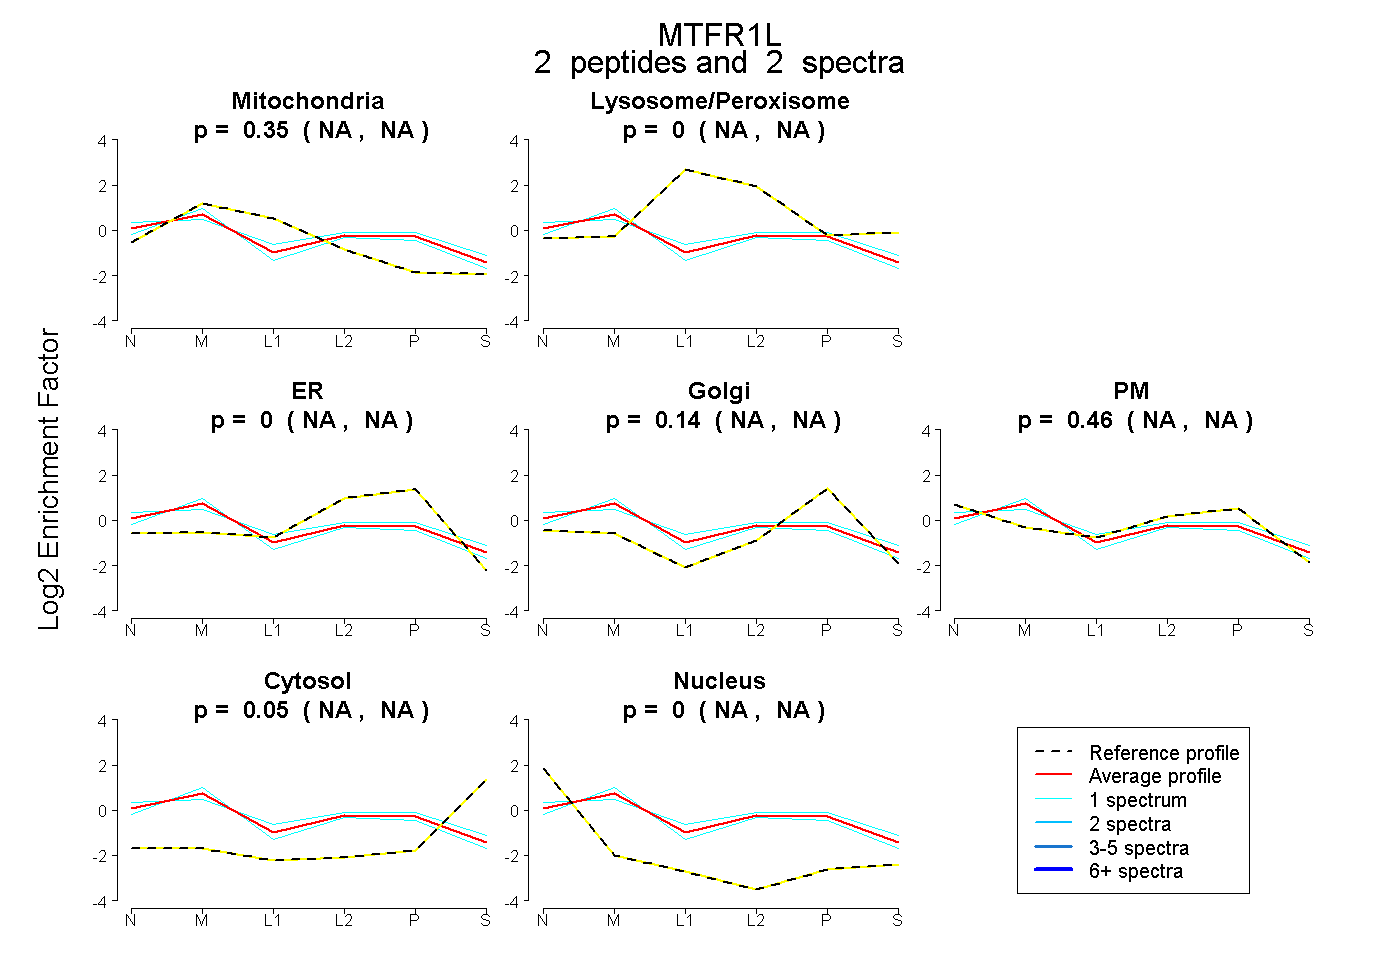
| Plot | Mito | Lyso or Perox | ER | Golgi | PM | Cytosol | Nucleus | ||||||
| Expt B |
2 peptides |
2 spectra |
|
0.346 NA | NA |
0.000 NA | NA |
0.000 NA | NA |
0.139 NA | NA |
0.464 NA | NA |
0.051 NA | NA |
0.000 NA | NA |
| 1 spectrum, TTELQDELSHLR | 0.473 | 0.000 | 0.000 | 0.362 | 0.162 | 0.003 | 0.000 | |||
| 1 spectrum, KPALPALSR | 0.220 | 0.042 | 0.000 | 0.000 | 0.655 | 0.083 | 0.000 |
| Plot | Lyso | Other | |||||||||||
| Expt C |
4 peptides |
14 spectra |
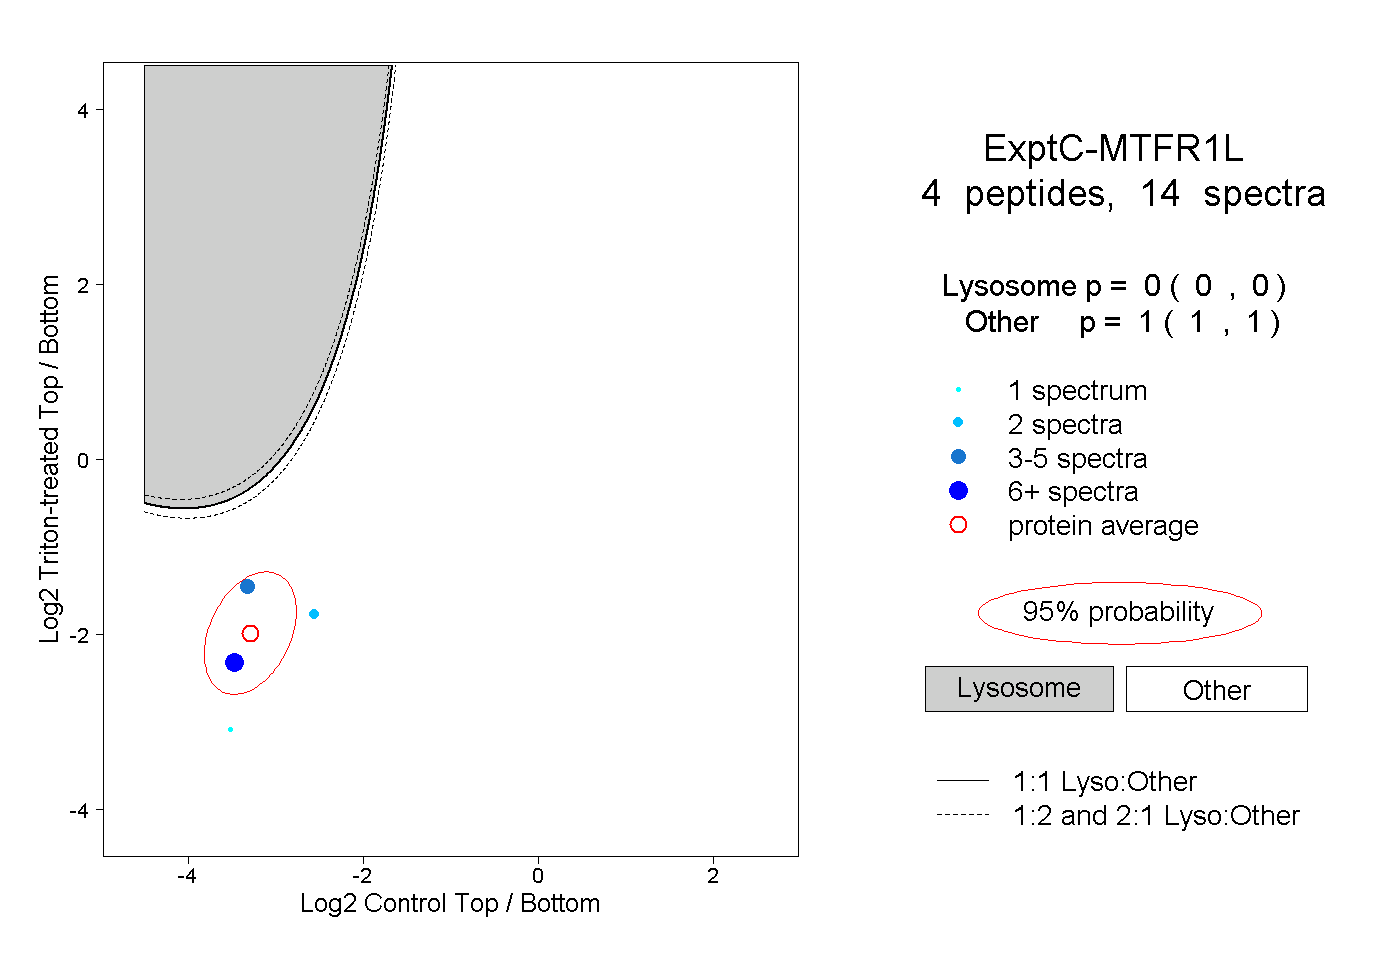 |
0.000 0.000 | 0.000 |
1.000 1.000 | 1.000 |