 3
3peptides
spectra
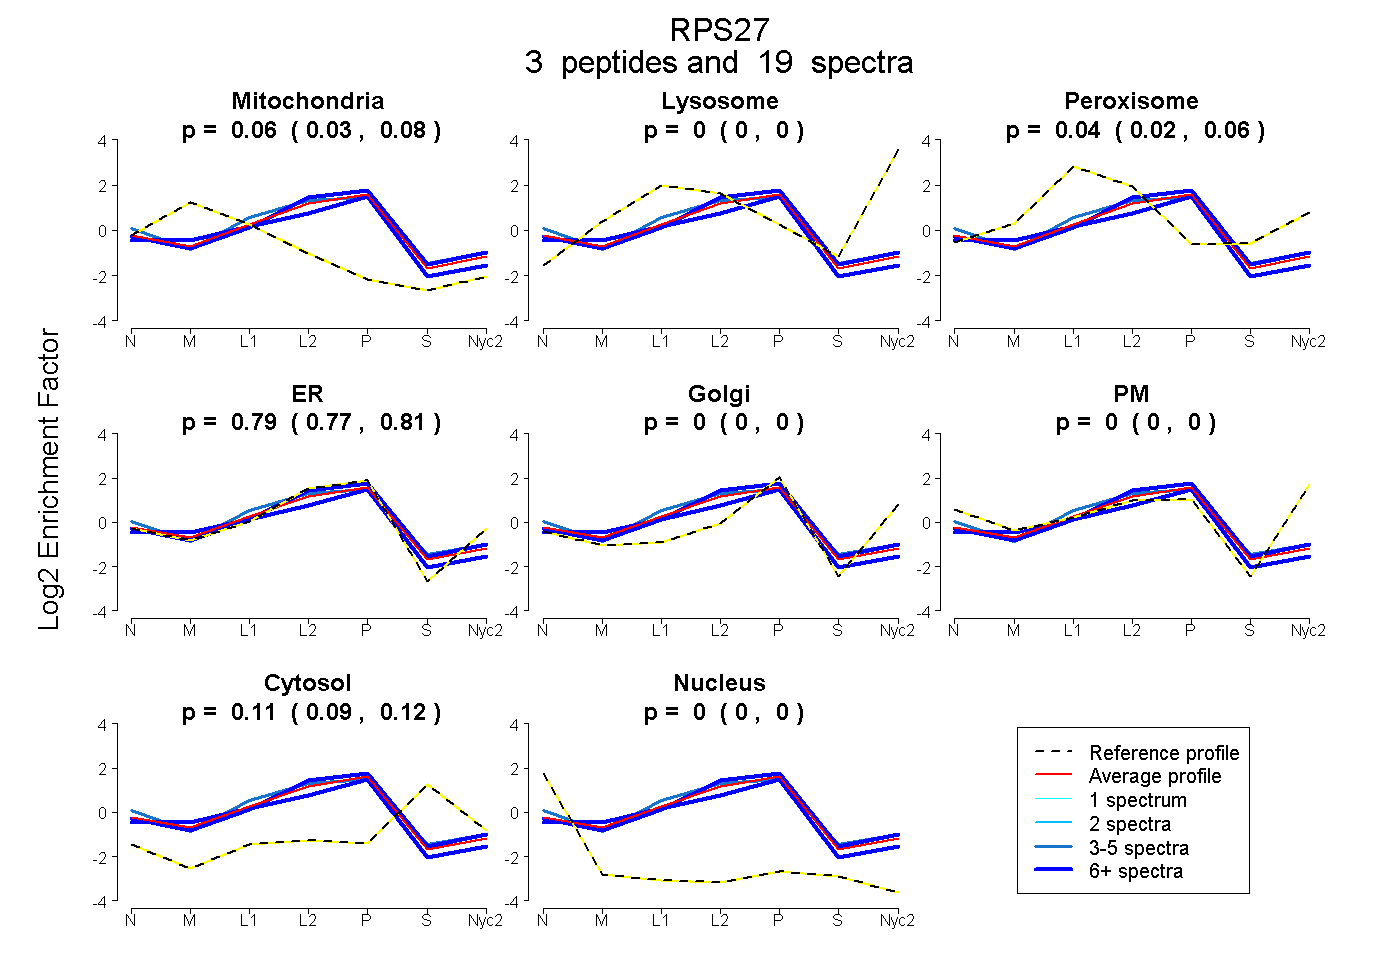
0.029 | 0.076
0.000 | 0.000
0.018 | 0.062
0.774 | 0.809
0.000 | 0.000
0.000 | 0.000
0.091 | 0.124
0.000 | 0.003
3peptides
spectra
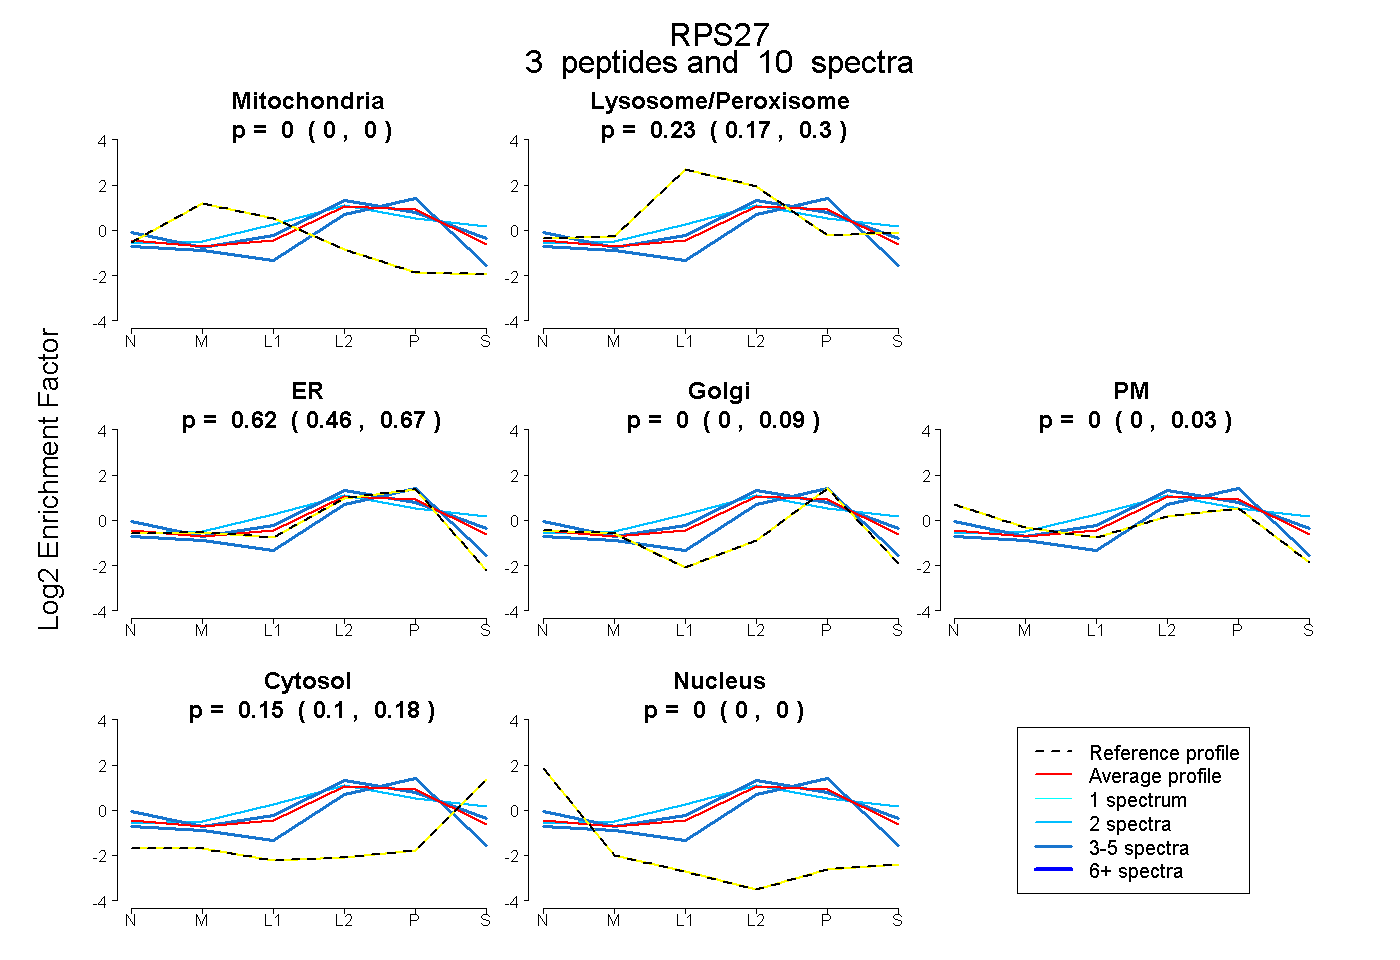
0.000 | 0.000
0.171 | 0.296
0.460 | 0.667
0.000 | 0.090
0.000 | 0.025
0.104 | 0.177
0.000 | 0.000
2peptides
spectra
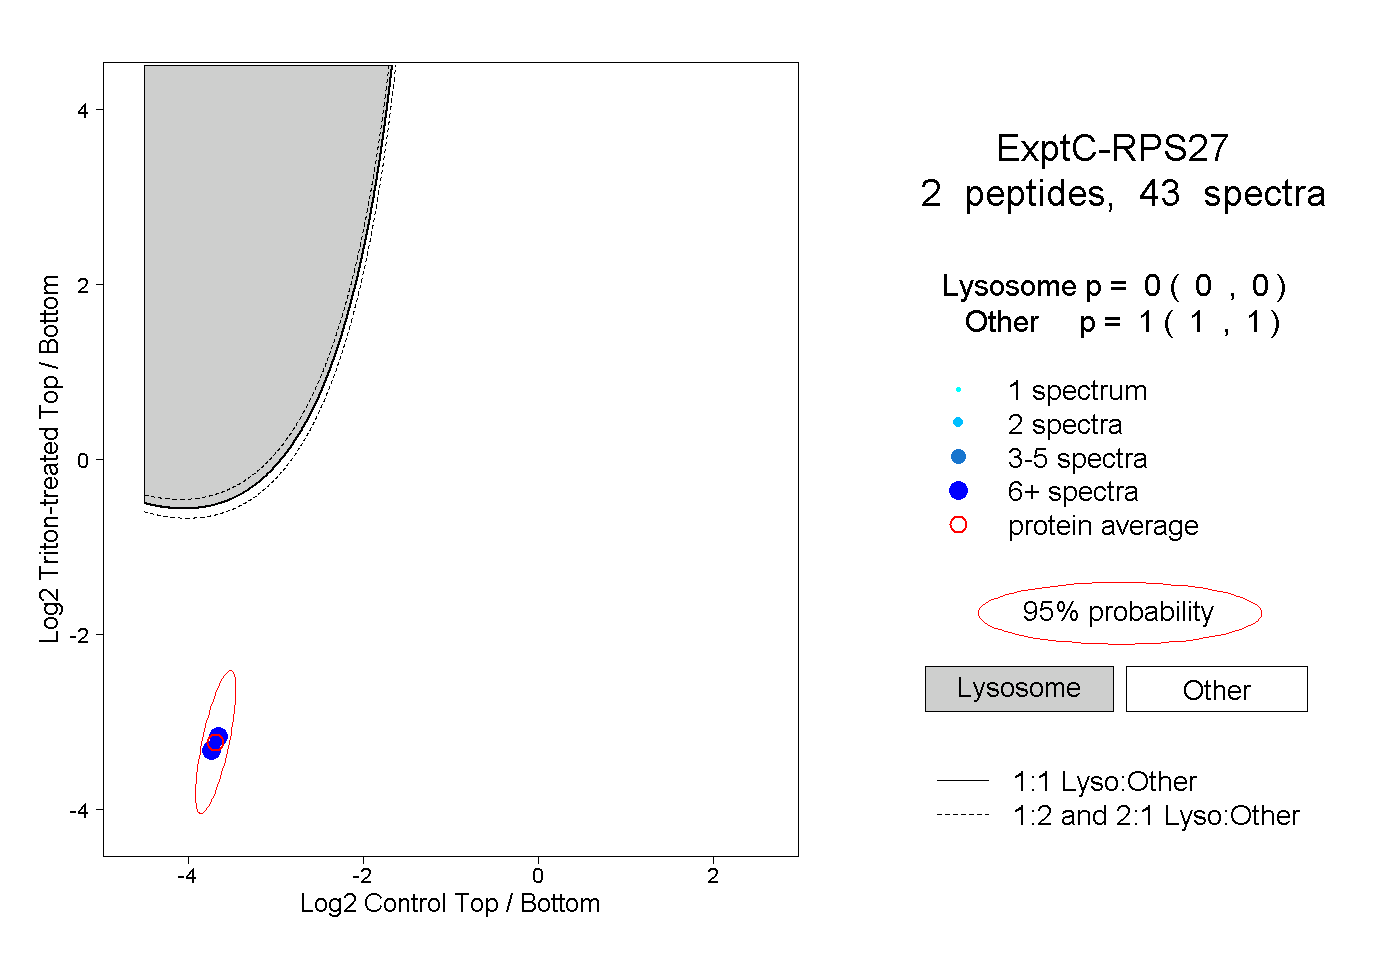
0.000 | 0.000
1.000 | 1.000
1peptide
spectra
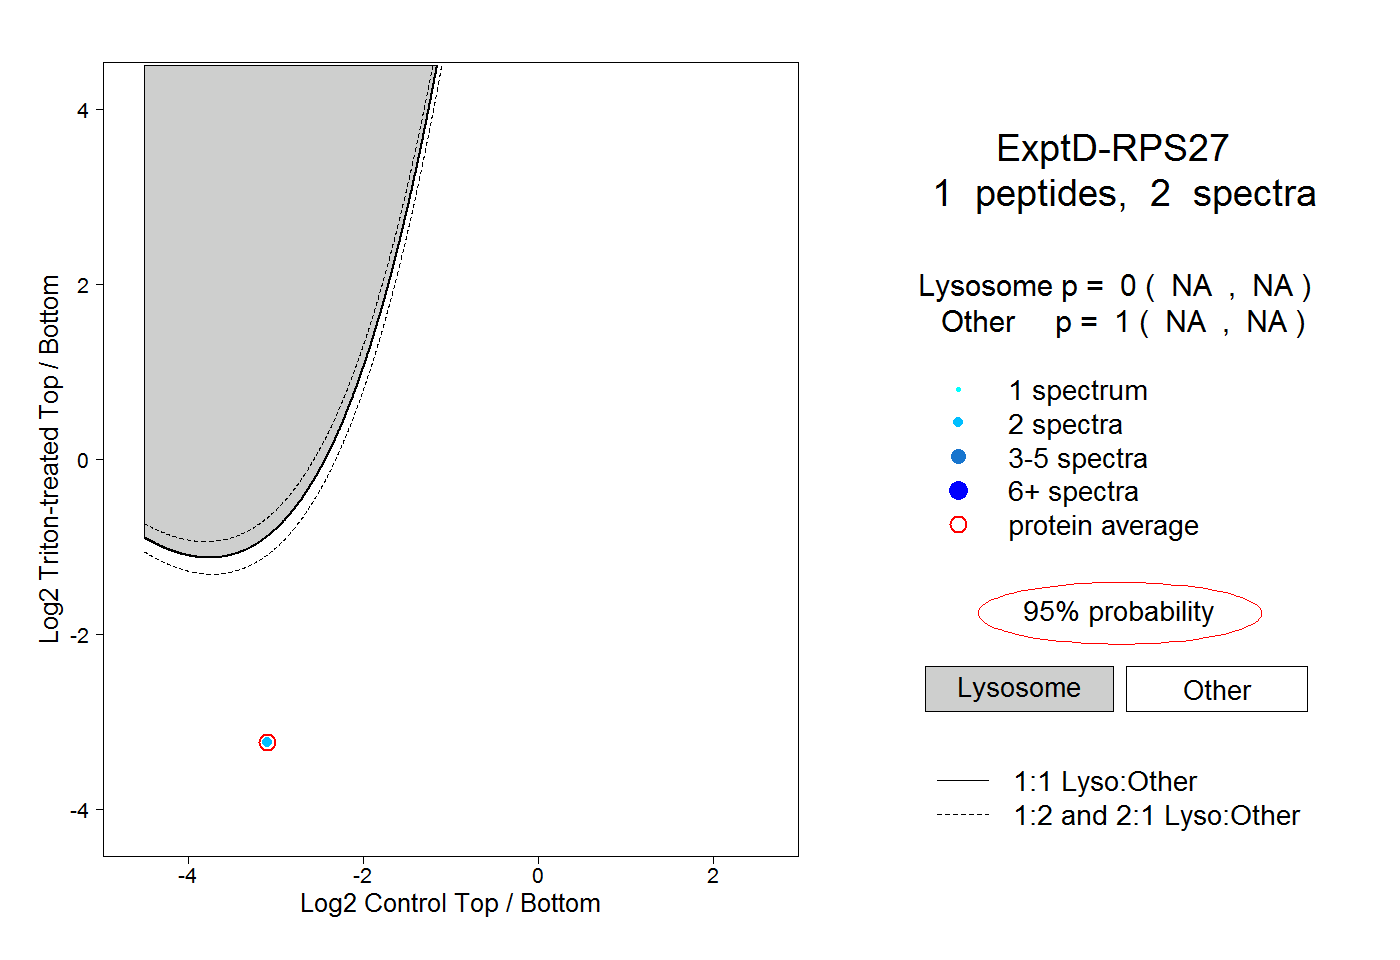
NA | NA
NA | NA