 3
3peptides
spectra
0.029 | 0.076
0.000 | 0.000
0.018 | 0.062
0.774 | 0.809
0.000 | 0.000
0.000 | 0.000
0.091 | 0.124
0.000 | 0.003
| Plot | Mito | Lyso | Perox | ER | Golgi | PM | Cytosol | Nucleus | |||||
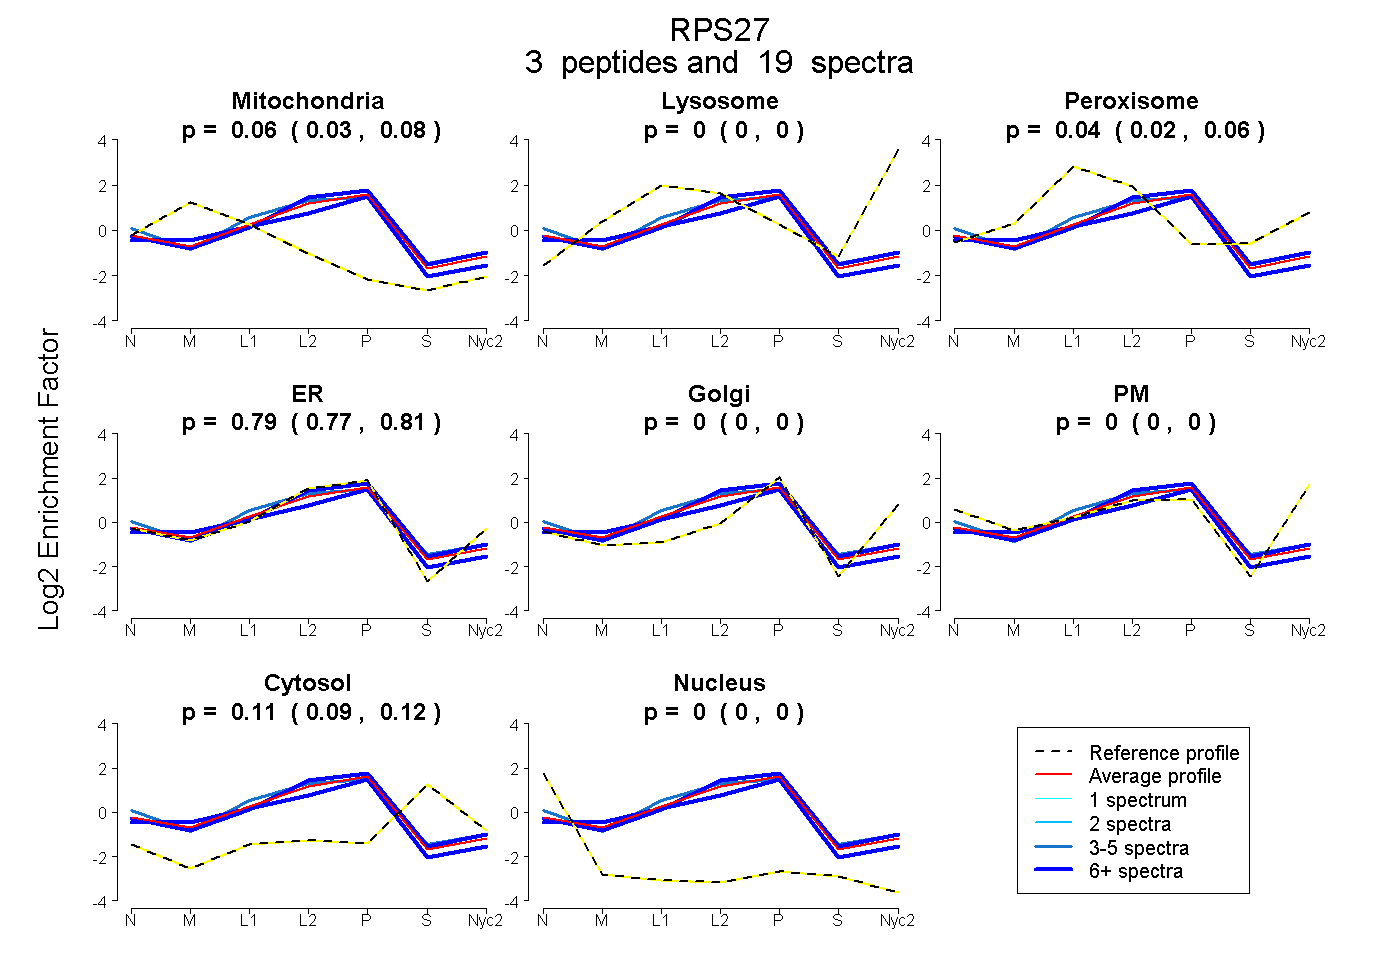
| Expt A |
3 peptides |
19 spectra |
|
0.056 0.029 | 0.076 |
0.000 0.000 | 0.000 |
0.040 0.018 | 0.062 |
0.794 0.774 | 0.809 |
0.000 0.000 | 0.000 |
0.000 0.000 | 0.000 |
0.109 0.091 | 0.124 |
0.000 0.000 | 0.003 |
| 5 spectra, DLLHPSPEEEK | 0.000 | 0.000 | 0.164 | 0.717 | 0.000 | 0.000 | 0.084 | 0.035 | ||
| 8 spectra, LTEGCSFR | 0.000 | 0.000 | 0.048 | 0.829 | 0.000 | 0.000 | 0.123 | 0.000 | ||
| 6 spectra, LVQSPNSYFMDVK | 0.173 | 0.000 | 0.000 | 0.752 | 0.000 | 0.000 | 0.067 | 0.007 |
| Plot | Mito | Lyso or Perox | ER | Golgi | PM | Cytosol | Nucleus | ||||||
| Expt B |
3 peptides |
10 spectra |
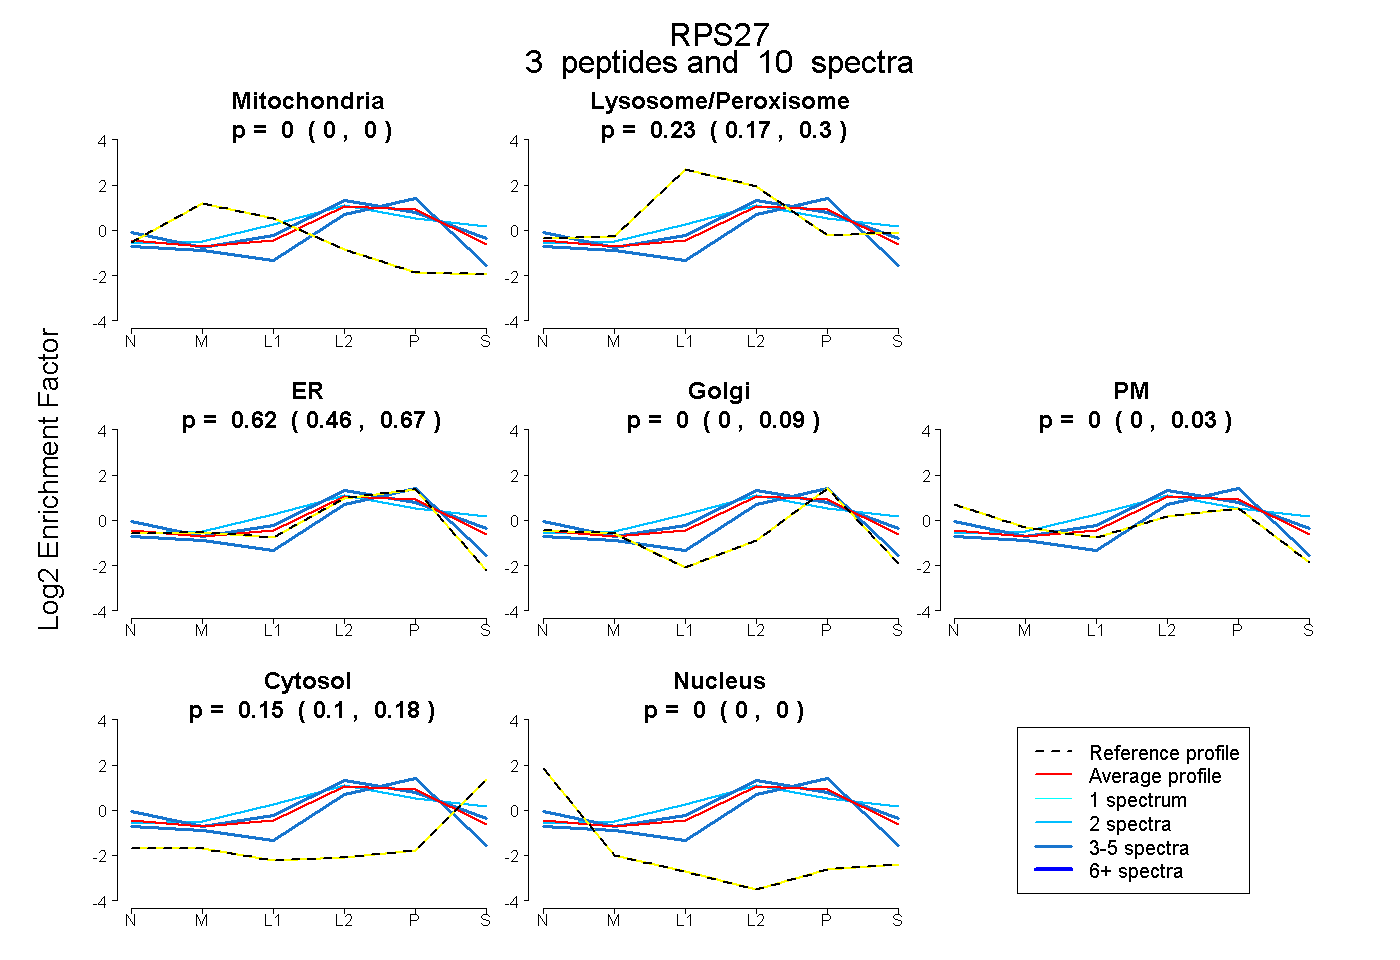 |
0.000 0.000 | 0.000 |
0.229 0.171 | 0.296 |
0.618 0.460 | 0.667 |
0.000 0.000 | 0.090 |
0.000 0.000 | 0.025 |
0.153 0.104 | 0.177 |
0.000 0.000 | 0.000 |
|||
| Plot | Lyso | Other | |||||||||||
| Expt C |
2 peptides |
43 spectra |
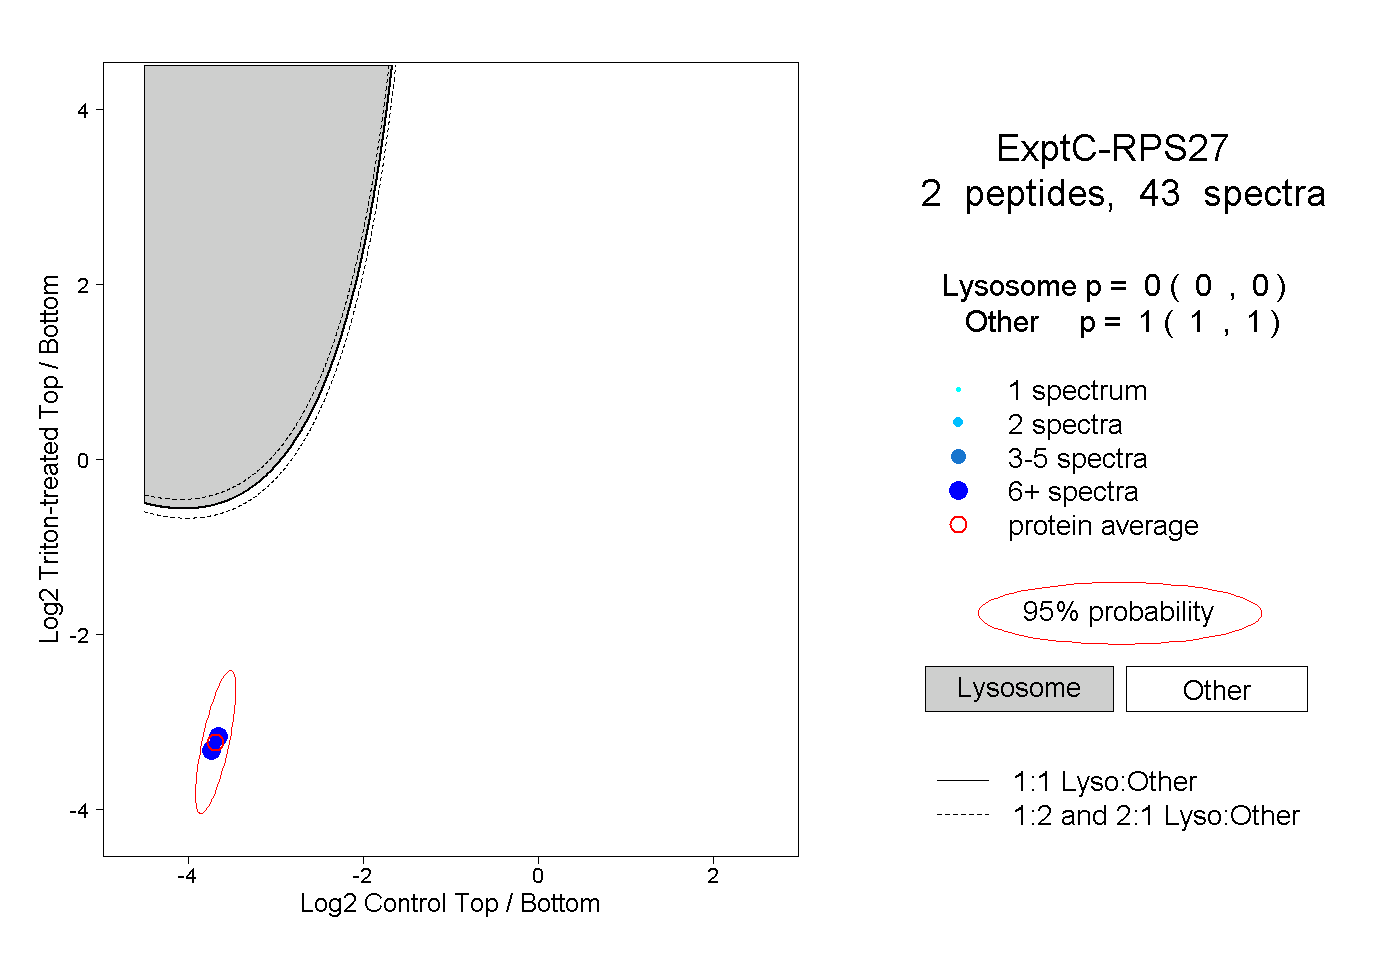 |
0.000 0.000 | 0.000 |
1.000 1.000 | 1.000 |
||||||||
| Plot | Lyso | Other | |||||||||||
| Expt D |
1 peptide |
2 spectra |
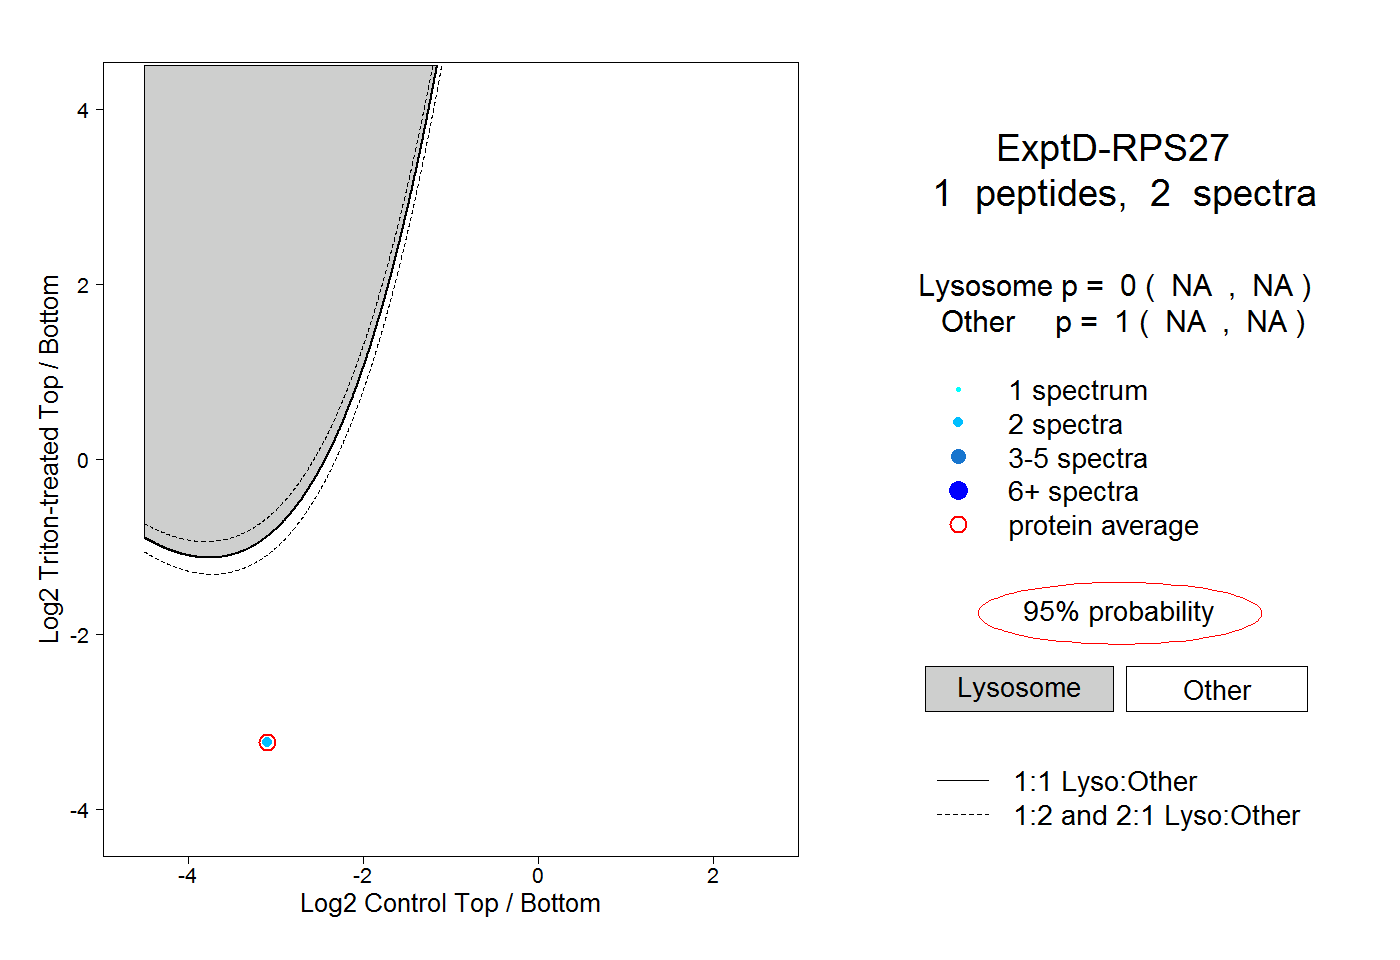 |
0.000 NA | NA |
1.000 NA | NA |