 5
5peptides
spectra
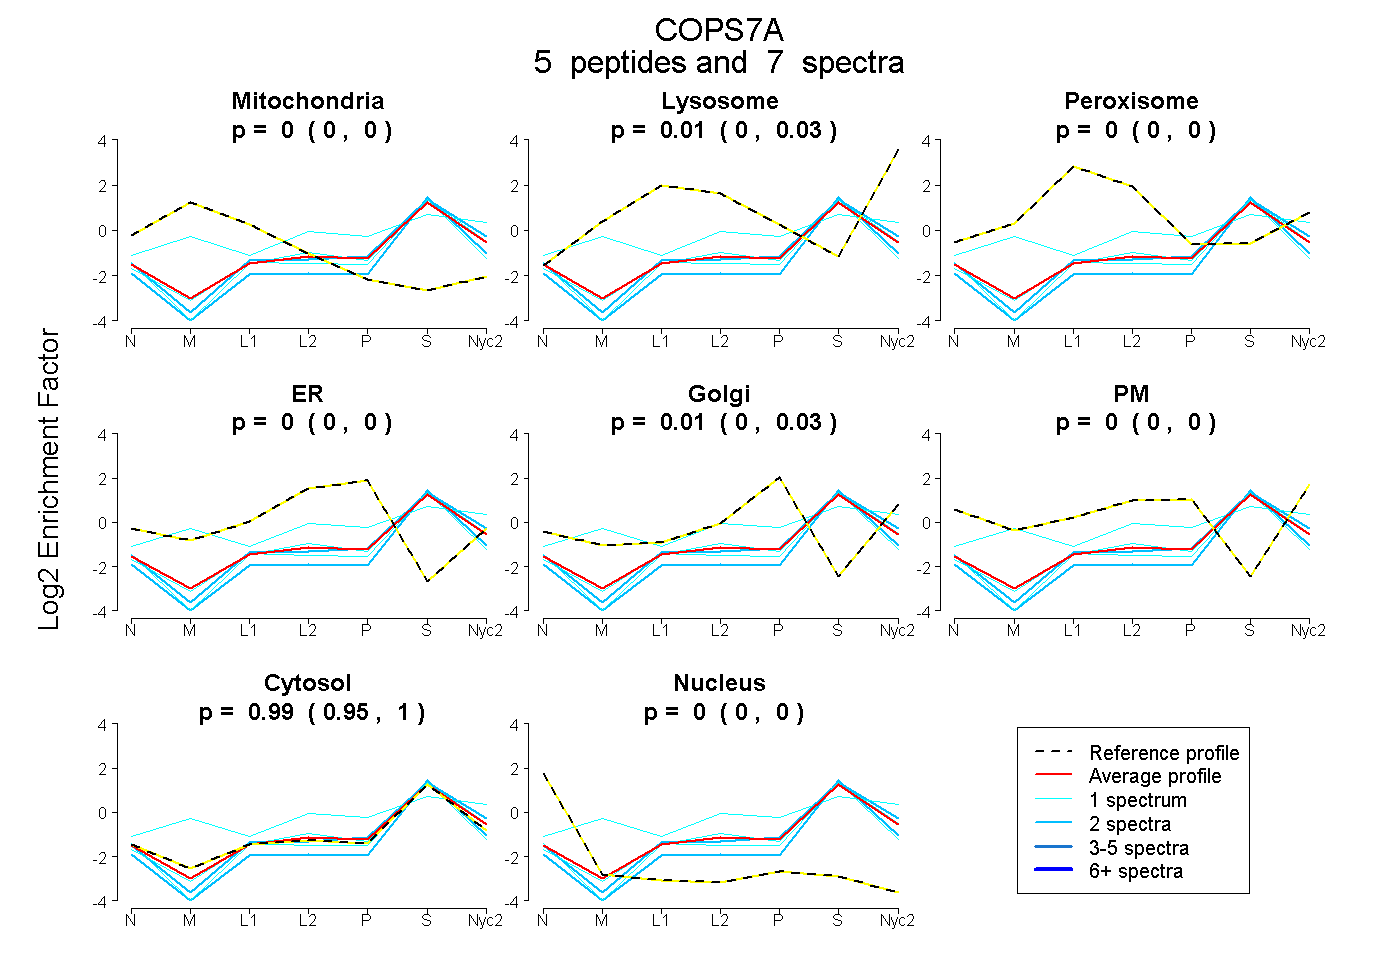
0.000 | 0.000
0.000 | 0.035
0.000 | 0.000
0.000 | 0.004
0.000 | 0.029
0.000 | 0.000
0.950 | 1.000
0.000 | 0.000
2peptides
spectra
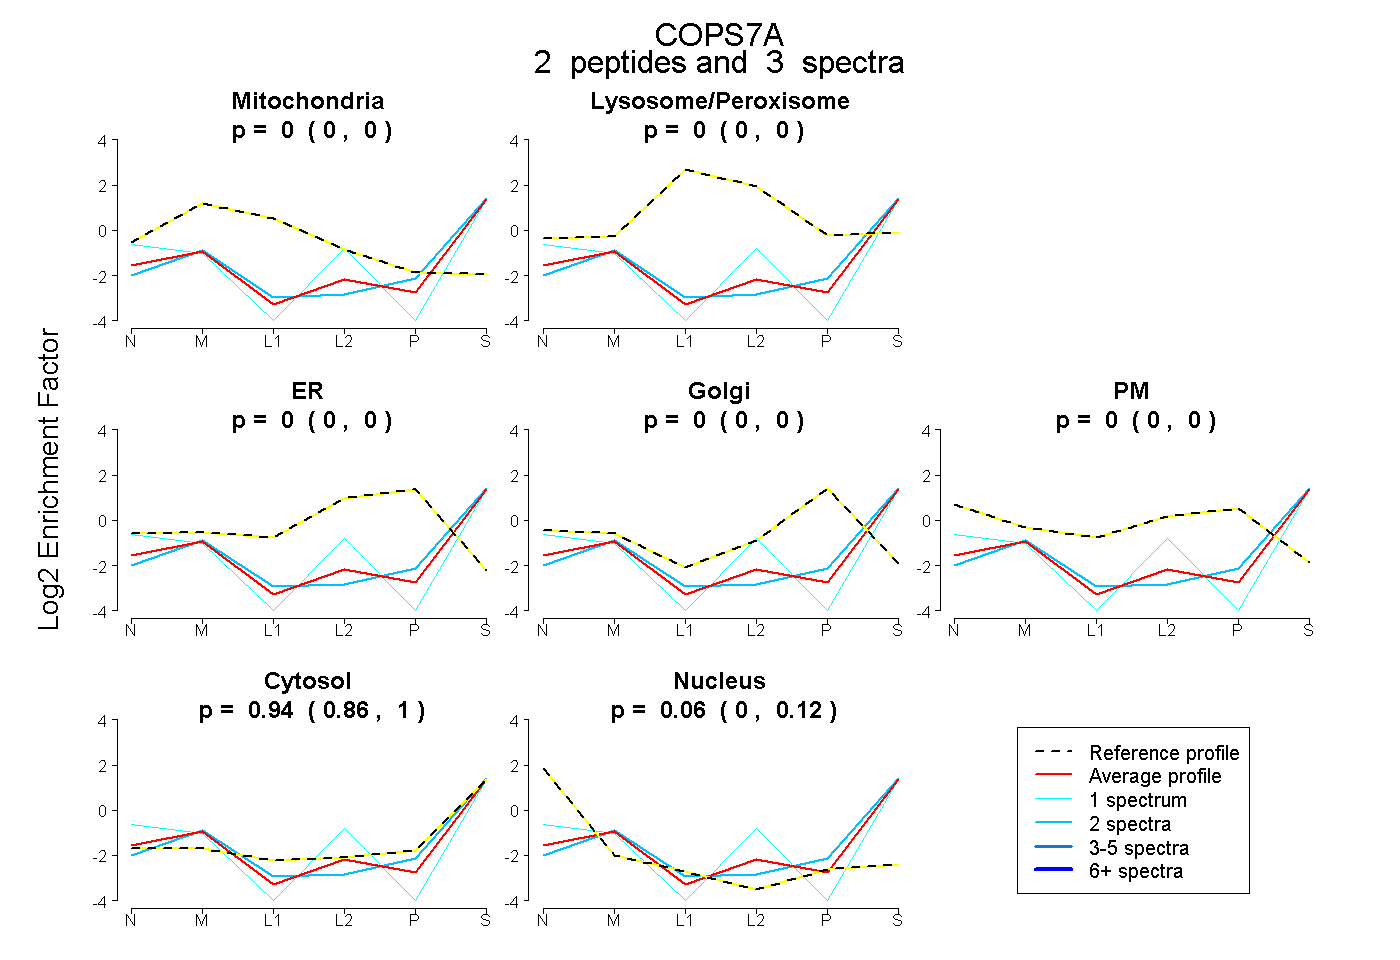
0.000 | 0.001
0.000 | 0.000
0.000 | 0.000
0.000 | 0.000
0.000 | 0.000
0.859 | 1.000
0.000 | 0.123
5peptides
spectra
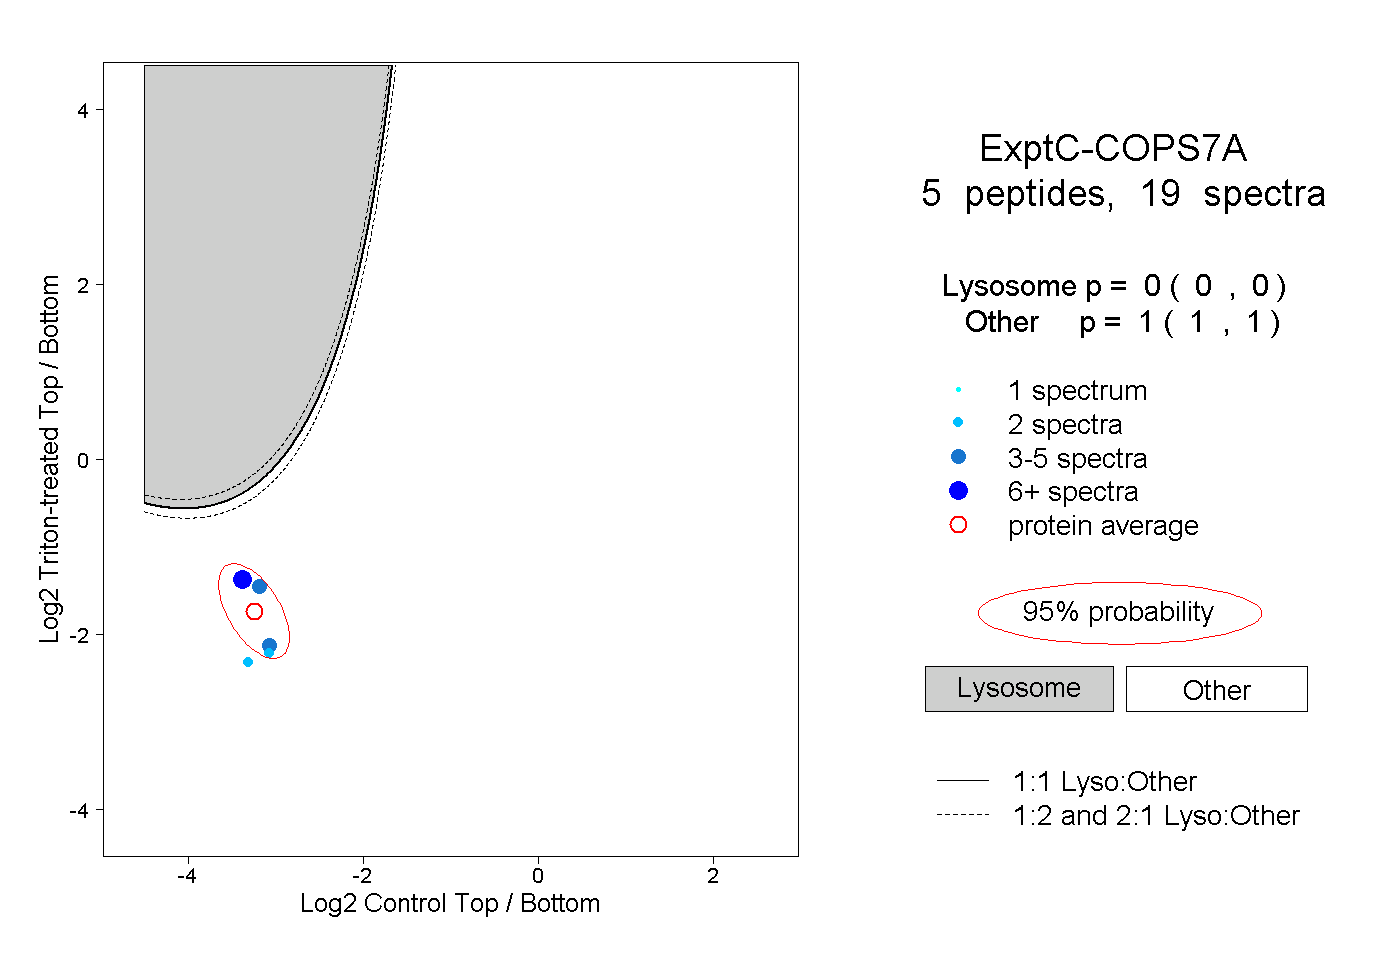
0.000 | 0.000
1.000 | 1.000