 5
5peptides
spectra
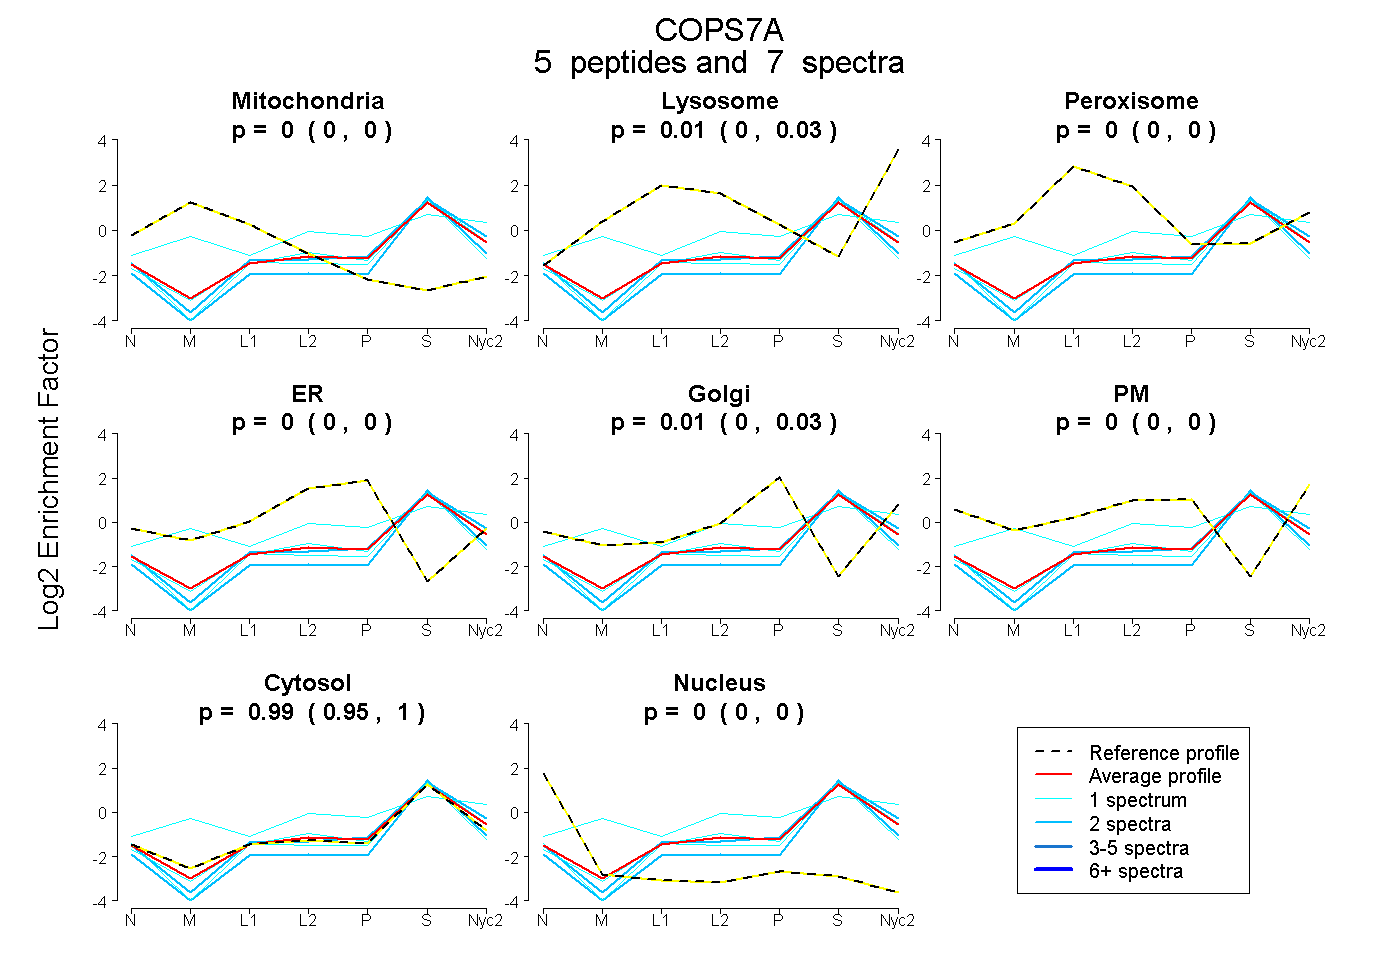
0.000 | 0.000
0.000 | 0.035
0.000 | 0.000
0.000 | 0.004
0.000 | 0.029
0.000 | 0.000
0.950 | 1.000
0.000 | 0.000
| Plot | Mito | Lyso | Perox | ER | Golgi | PM | Cytosol | Nucleus | |||||
| Expt A |
5 peptides |
7 spectra |
|
0.000 0.000 | 0.000 |
0.007 0.000 | 0.035 |
0.000 0.000 | 0.000 |
0.000 0.000 | 0.004 |
0.005 0.000 | 0.029 |
0.000 0.000 | 0.000 |
0.988 0.950 | 1.000 |
0.000 0.000 | 0.000 |
| 2 spectra, GSLDQR | 0.000 | 0.000 | 0.000 | 0.000 | 0.000 | 0.000 | 1.000 | 0.000 | ||
| 1 spectrum, QLEDLVIEAVYADVLR | 0.000 | 0.000 | 0.000 | 0.000 | 0.000 | 0.000 | 0.988 | 0.012 | ||
| 1 spectrum, EPAPGTNQR | 0.000 | 0.000 | 0.000 | 0.000 | 0.000 | 0.000 | 1.000 | 0.000 | ||
| 2 spectra, ELADSDFASTFR | 0.000 | 0.000 | 0.000 | 0.000 | 0.000 | 0.000 | 0.970 | 0.030 | ||
| 1 spectrum, NLPPLTEAQK | 0.064 | 0.259 | 0.000 | 0.000 | 0.120 | 0.000 | 0.557 | 0.000 |
| Plot | Mito | Lyso or Perox | ER | Golgi | PM | Cytosol | Nucleus | ||||||
| Expt B |
2 peptides |
3 spectra |
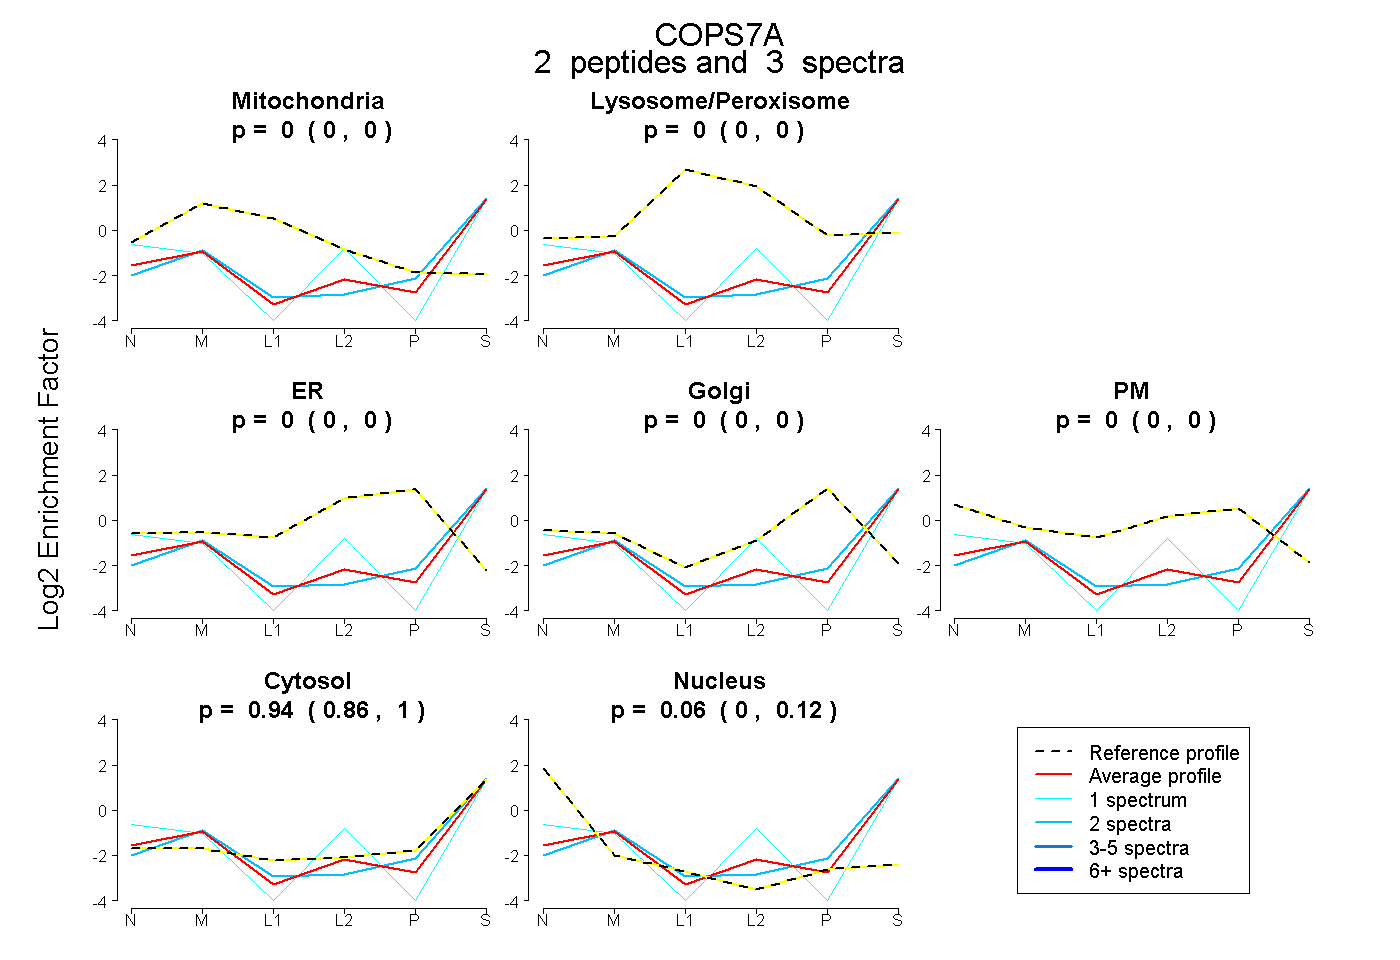 |
0.000 0.000 | 0.001 |
0.000 0.000 | 0.000 |
0.000 0.000 | 0.000 |
0.000 0.000 | 0.000 |
0.000 0.000 | 0.000 |
0.942 0.859 | 1.000 |
0.058 0.000 | 0.123 |
|||
| Plot | Lyso | Other | |||||||||||
| Expt C |
5 peptides |
19 spectra |
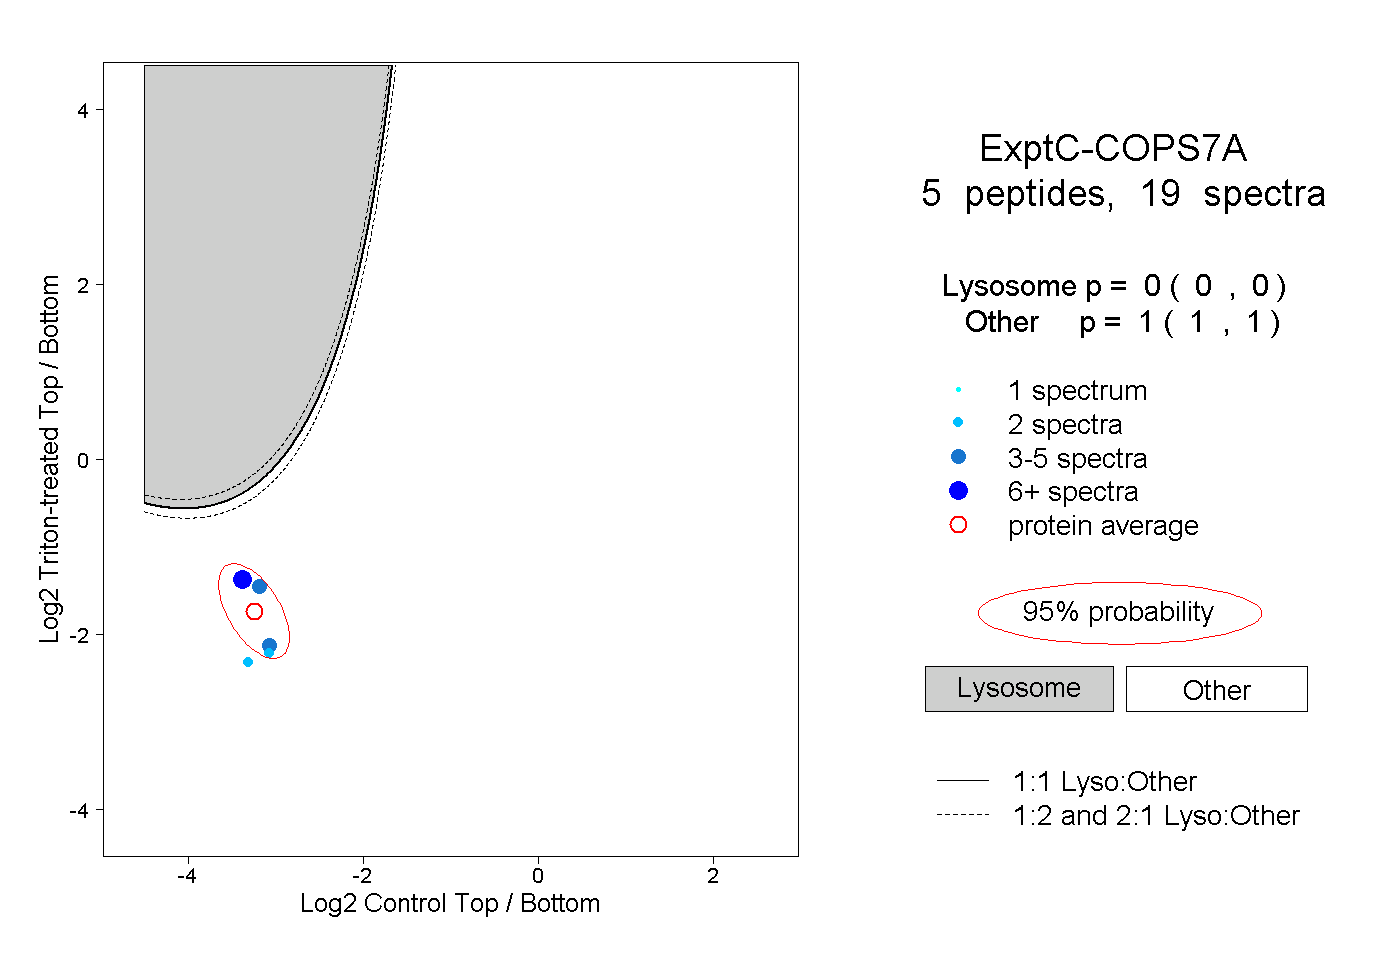 |
0.000 0.000 | 0.000 |
1.000 1.000 | 1.000 |