 4
4peptides
spectra
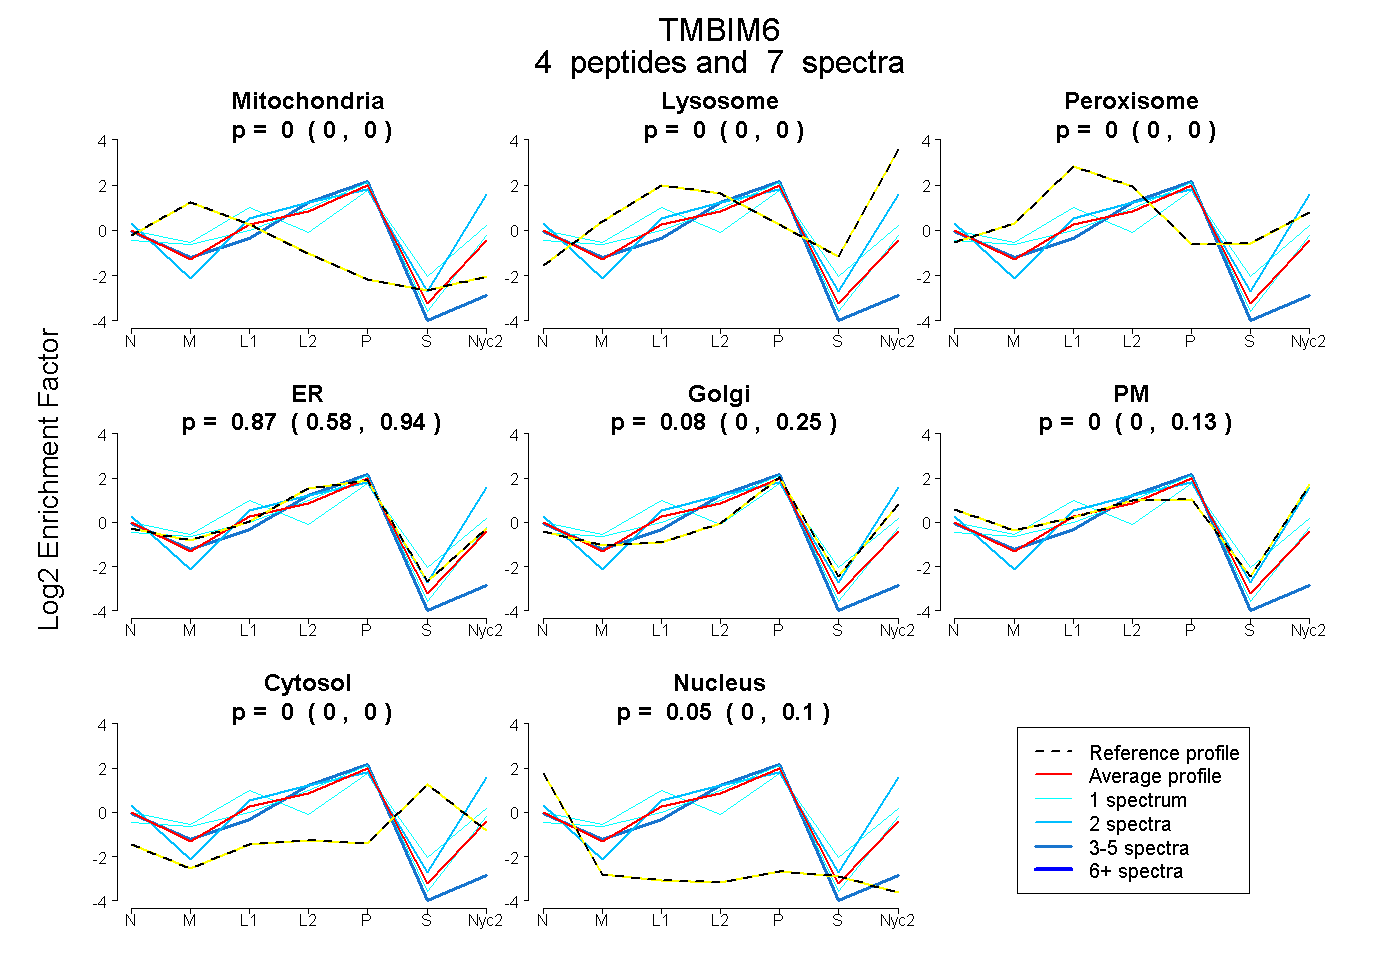
0.000 | 0.000
0.000 | 0.000
0.000 | 0.000
0.579 | 0.938
0.000 | 0.251
0.000 | 0.127
0.000 | 0.000
0.000 | 0.096
2peptides
spectra
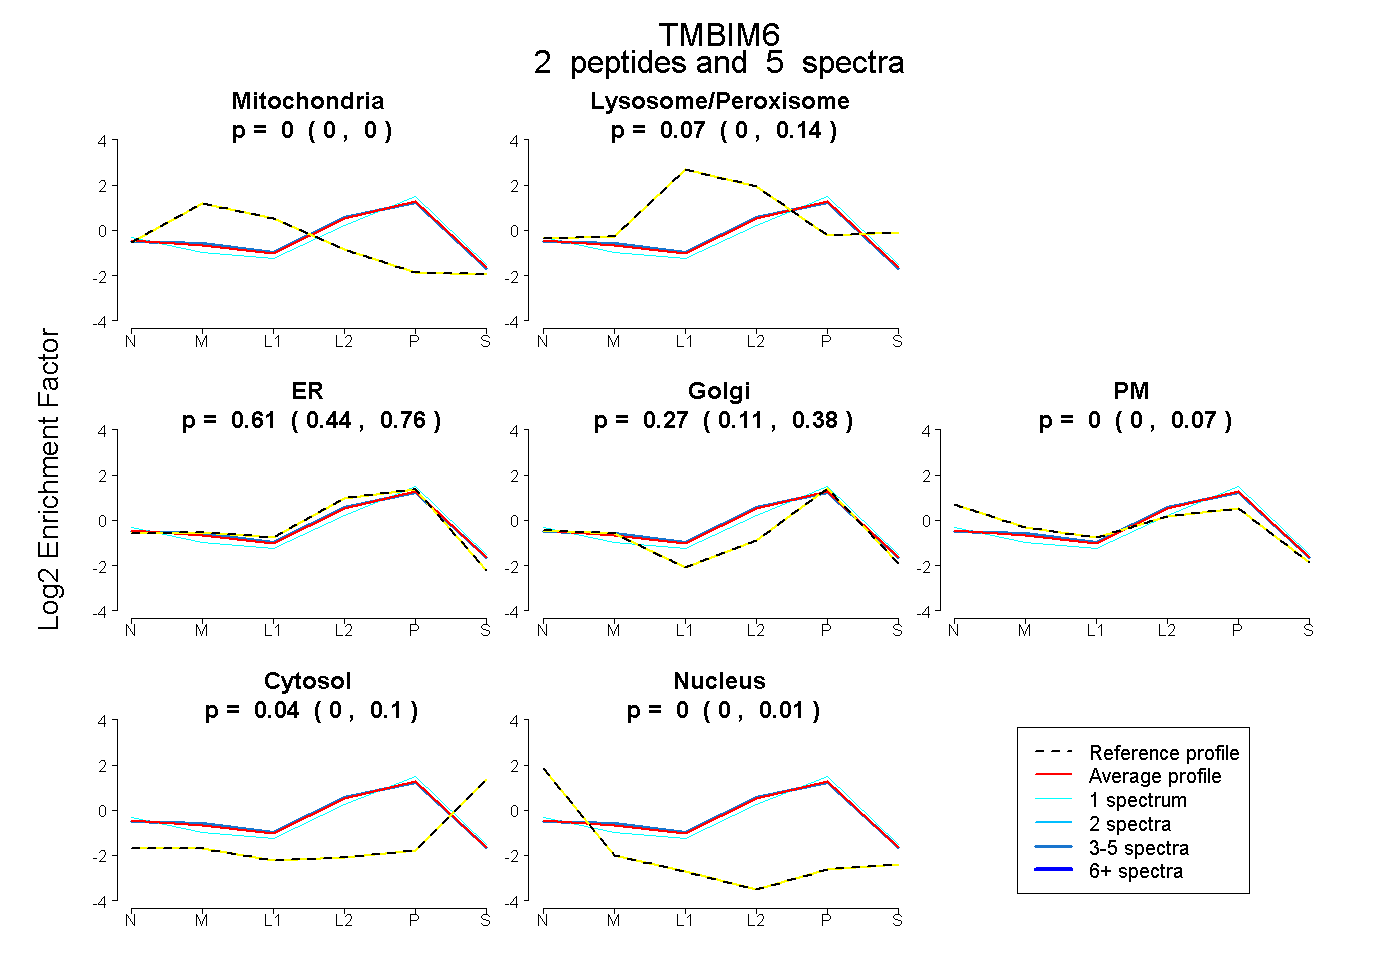
0.000 | 0.000
0.000 | 0.137
0.441 | 0.760
0.109 | 0.377
0.000 | 0.065
0.000 | 0.096
0.000 | 0.013
2peptides
spectra
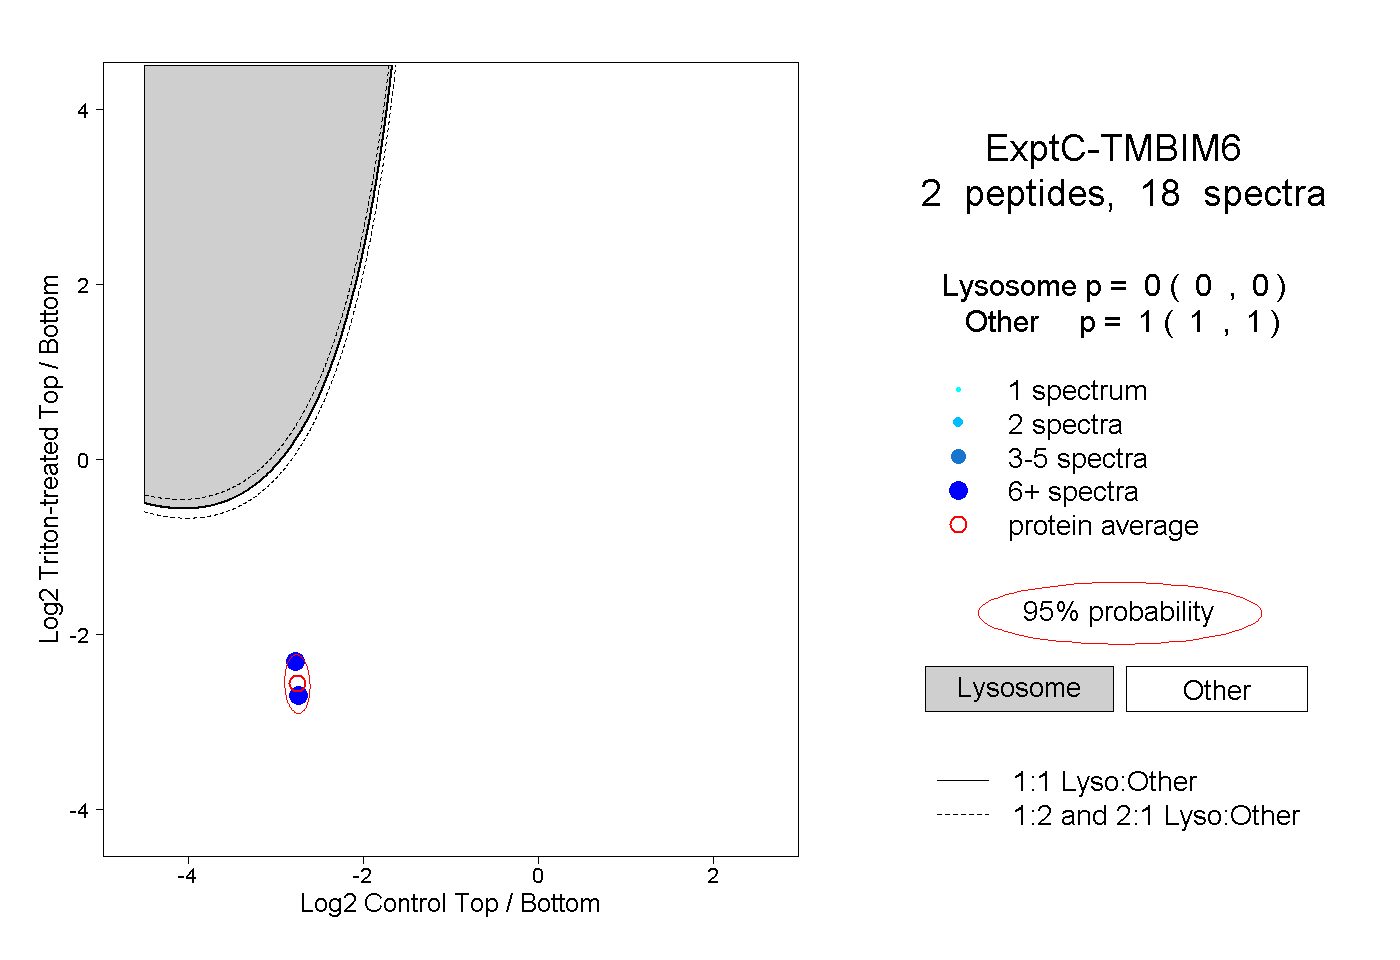
0.000 | 0.000
1.000 | 1.000
2peptides
spectra
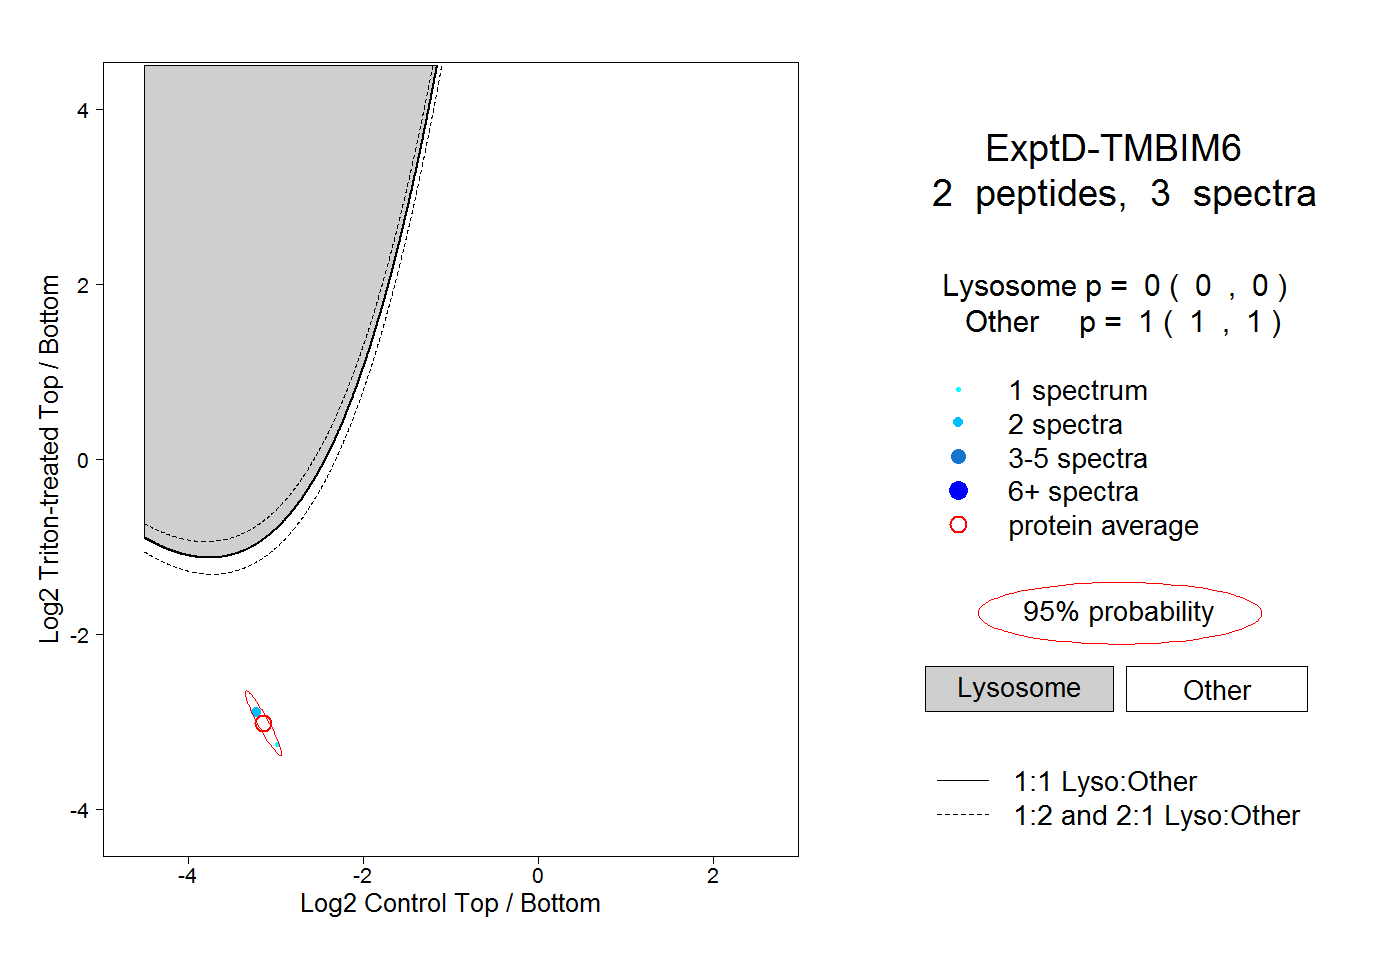
0.000 | 0.000
1.000 | 1.000