 4
4peptides
spectra
0.000 | 0.000
0.000 | 0.000
0.000 | 0.000
0.579 | 0.938
0.000 | 0.251
0.000 | 0.127
0.000 | 0.000
0.000 | 0.096
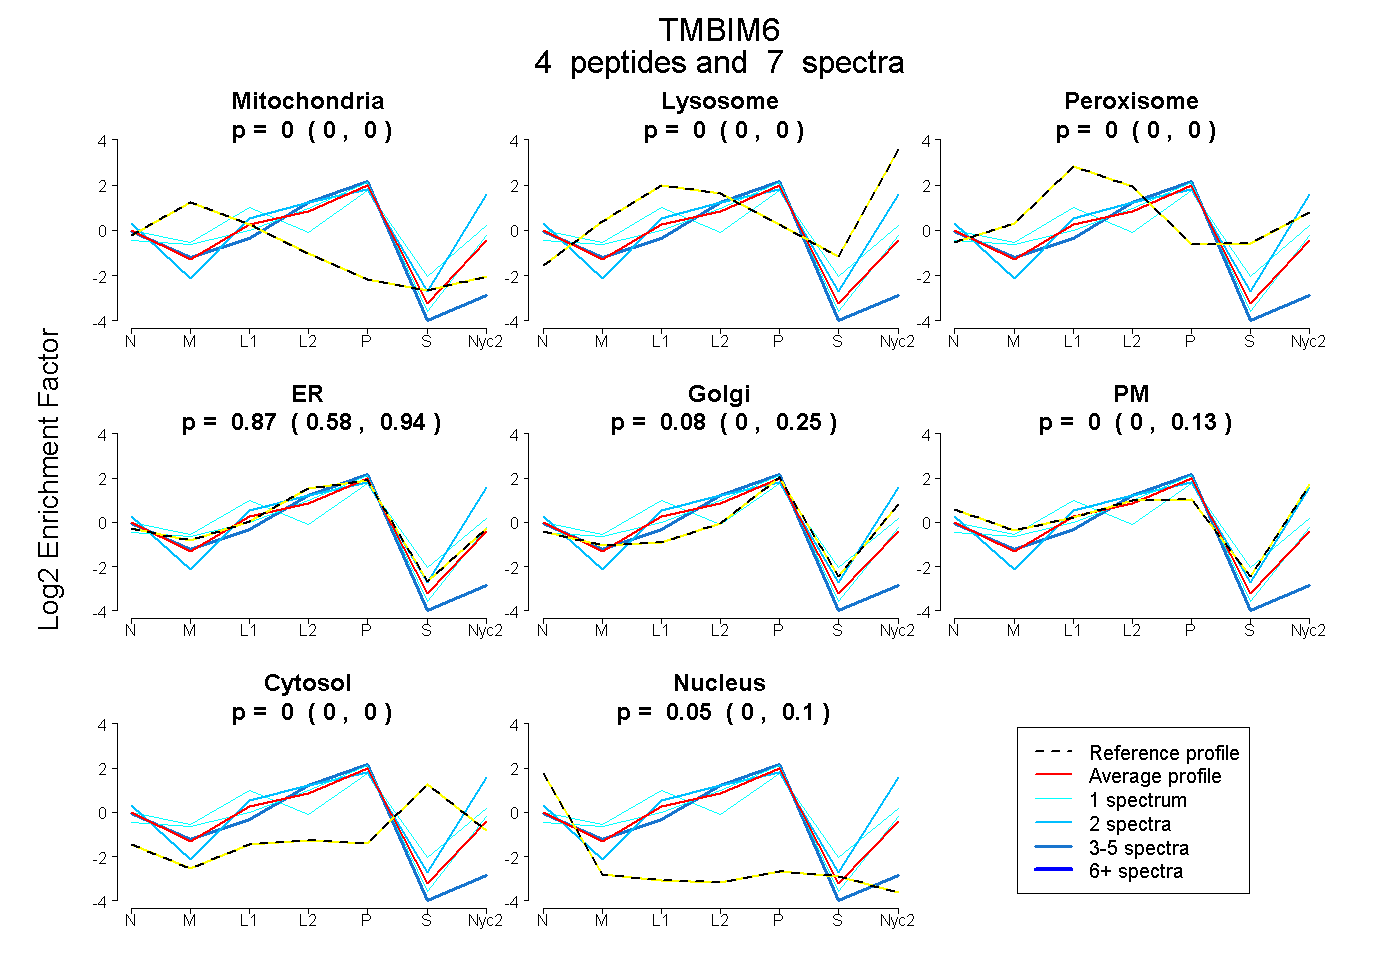
| Plot | Mito | Lyso | Perox | ER | Golgi | PM | Cytosol | Nucleus | |||||
| Expt A |
4 peptides |
7 spectra |
|
0.000 0.000 | 0.000 |
0.000 0.000 | 0.000 |
0.000 0.000 | 0.000 |
0.868 0.579 | 0.938 |
0.078 0.000 | 0.251 |
0.000 0.000 | 0.127 |
0.000 0.000 | 0.000 |
0.054 0.000 | 0.096 |
| 1 spectrum, MNIFDR | 0.018 | 0.000 | 0.000 | 0.807 | 0.174 | 0.000 | 0.000 | 0.000 | ||
| 3 spectra, INFDALLK | 0.000 | 0.000 | 0.000 | 0.836 | 0.000 | 0.000 | 0.000 | 0.164 | ||
| 2 spectra, LMLILAFNEK | 0.000 | 0.010 | 0.000 | 0.258 | 0.158 | 0.574 | 0.000 | 0.000 | ||
| 1 spectrum, FSHITPSTQQHLK | 0.055 | 0.000 | 0.239 | 0.135 | 0.571 | 0.000 | 0.000 | 0.000 |
| Plot | Mito | Lyso or Perox | ER | Golgi | PM | Cytosol | Nucleus | ||||||
| Expt B |
2 peptides |
5 spectra |
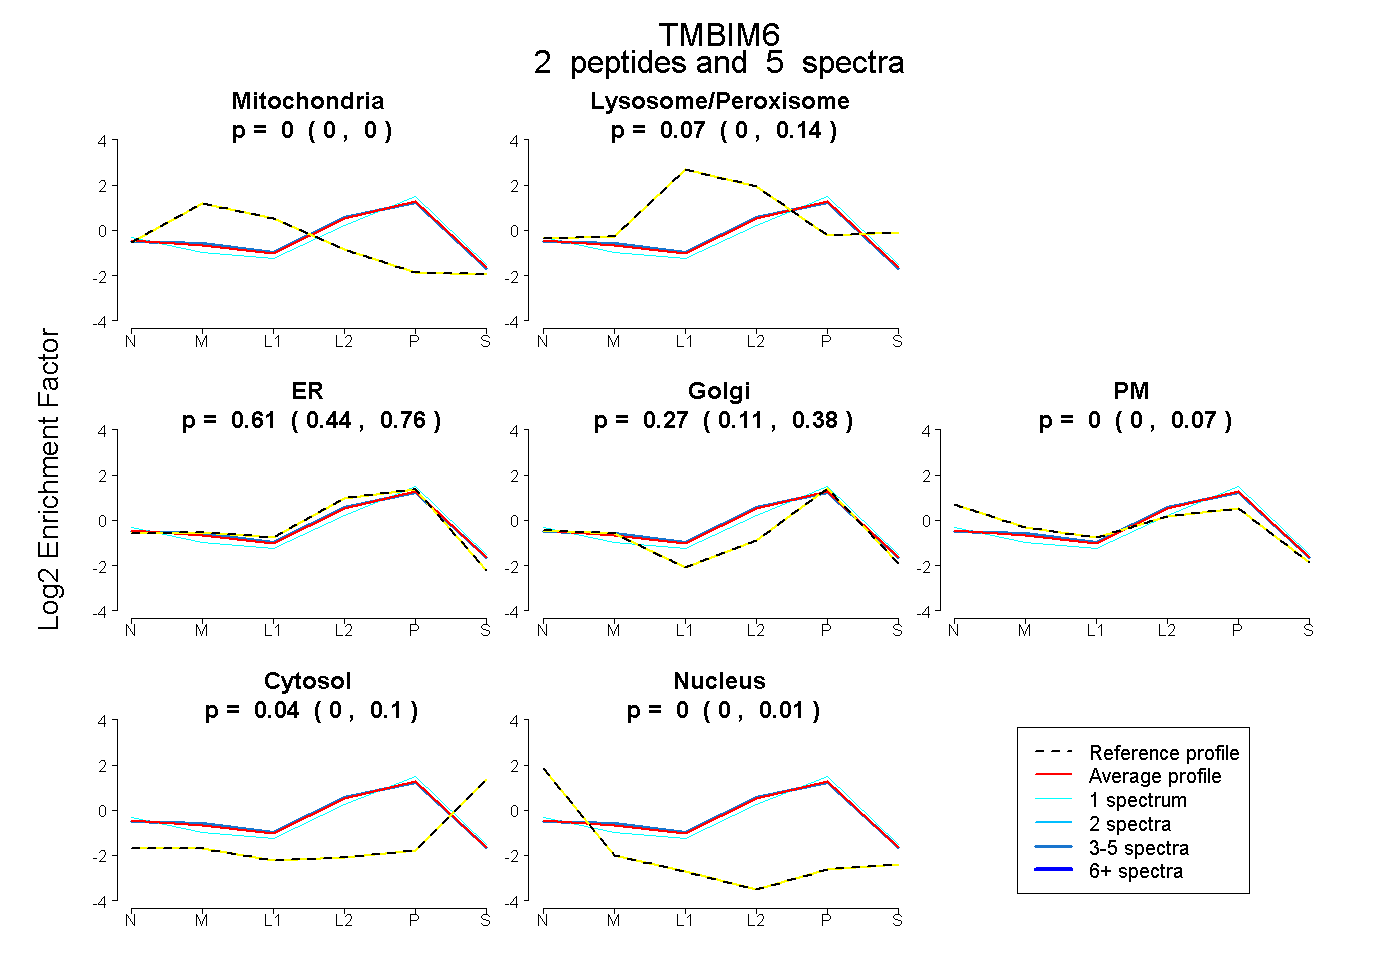 |
0.000 0.000 | 0.000 |
0.070 0.000 | 0.137 |
0.615 0.441 | 0.760 |
0.272 0.109 | 0.377 |
0.000 0.000 | 0.065 |
0.042 0.000 | 0.096 |
0.000 0.000 | 0.013 |
|||
| Plot | Lyso | Other | |||||||||||
| Expt C |
2 peptides |
18 spectra |
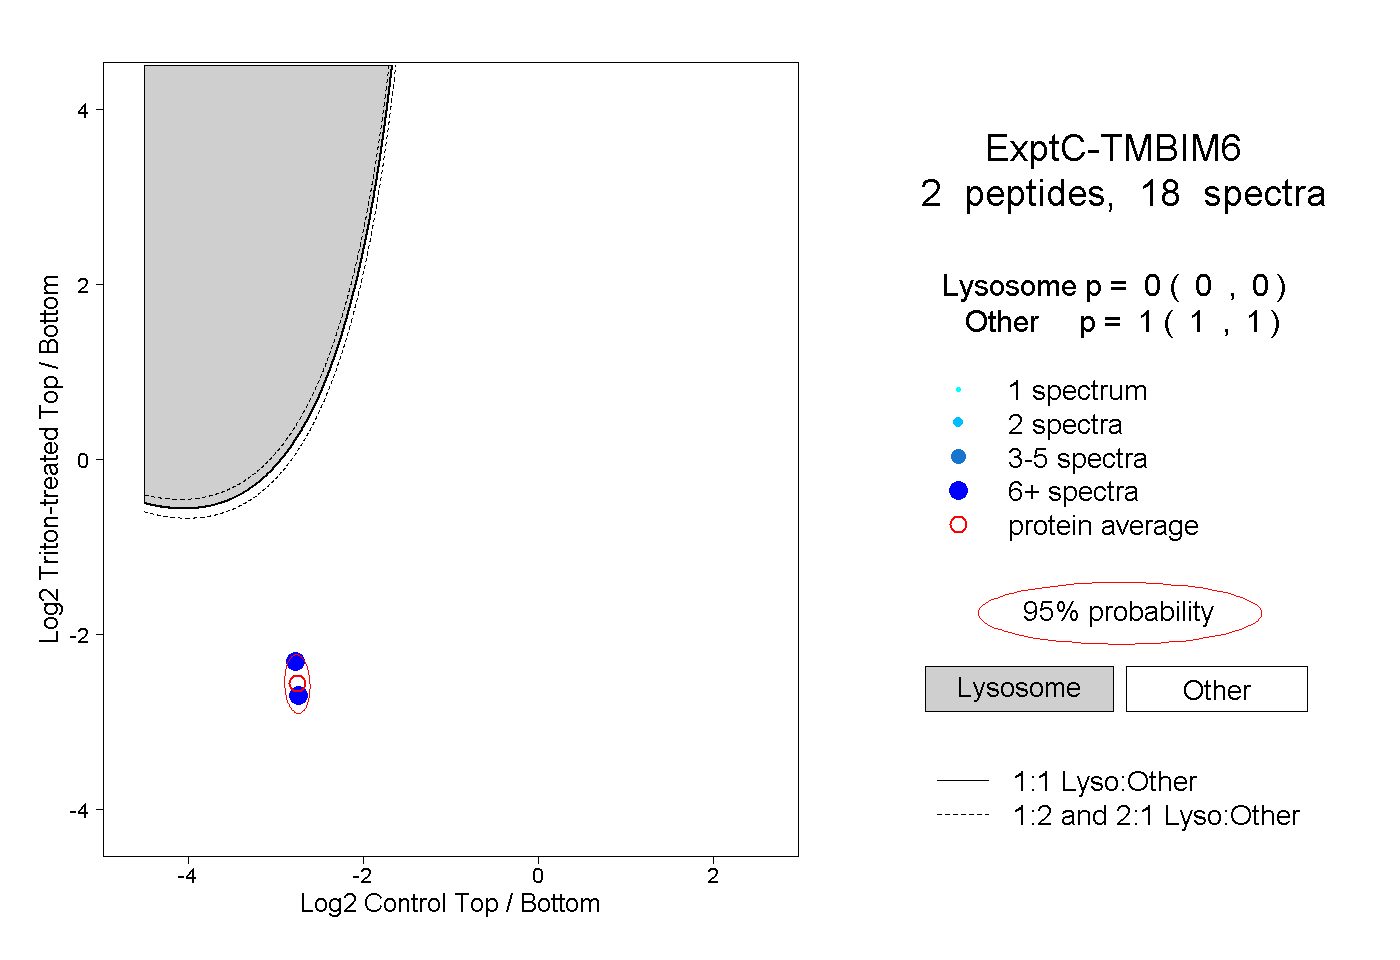 |
0.000 0.000 | 0.000 |
1.000 1.000 | 1.000 |
||||||||
| Plot | Lyso | Other | |||||||||||
| Expt D |
2 peptides |
3 spectra |
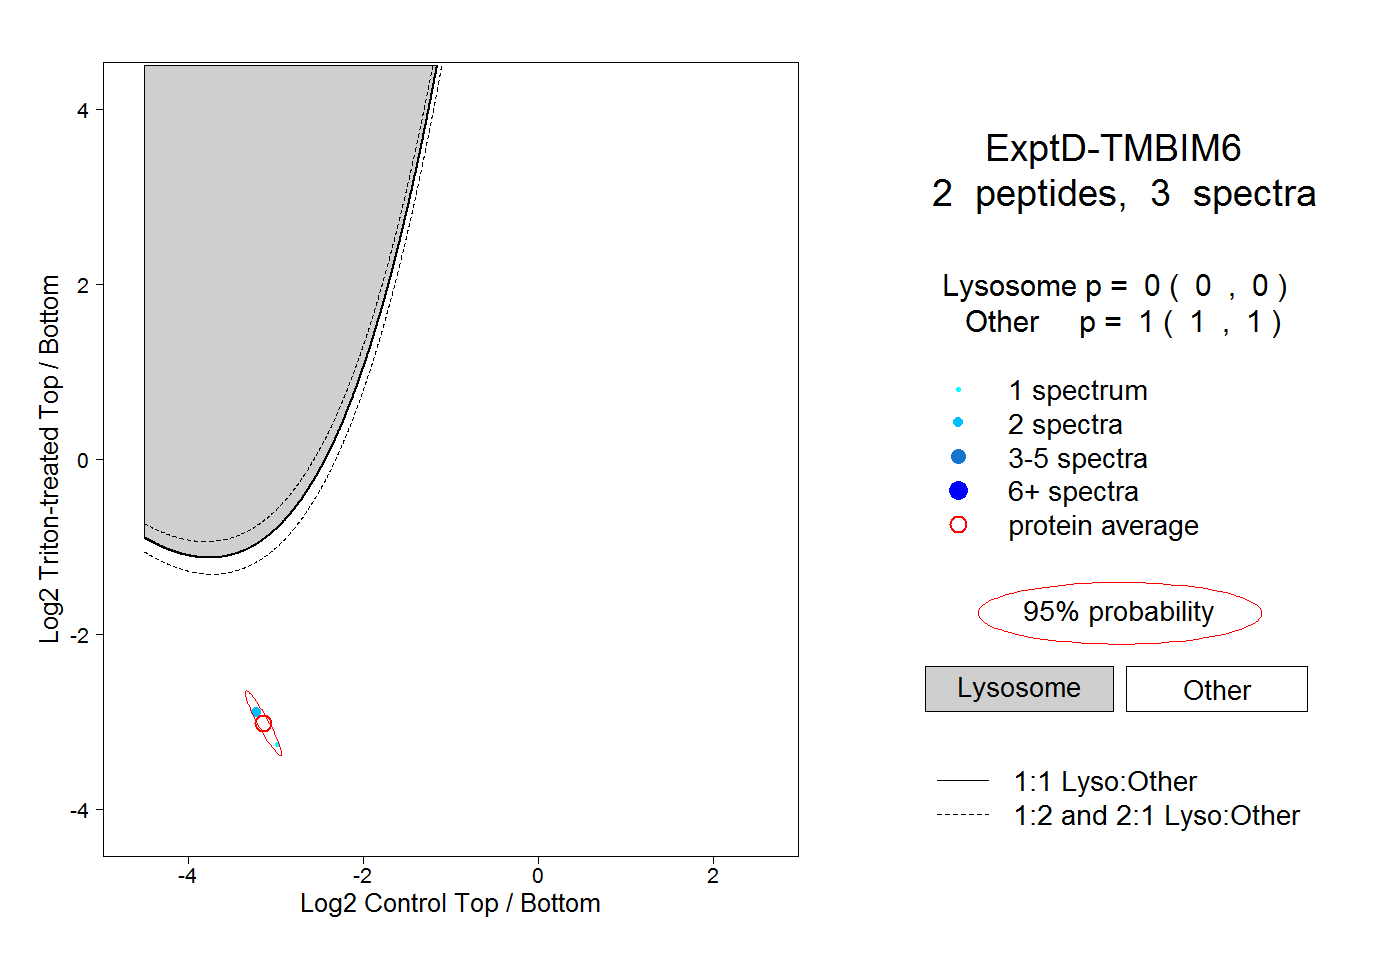 |
0.000 0.000 | 0.000 |
1.000 1.000 | 1.000 |