 24
24peptides
spectra
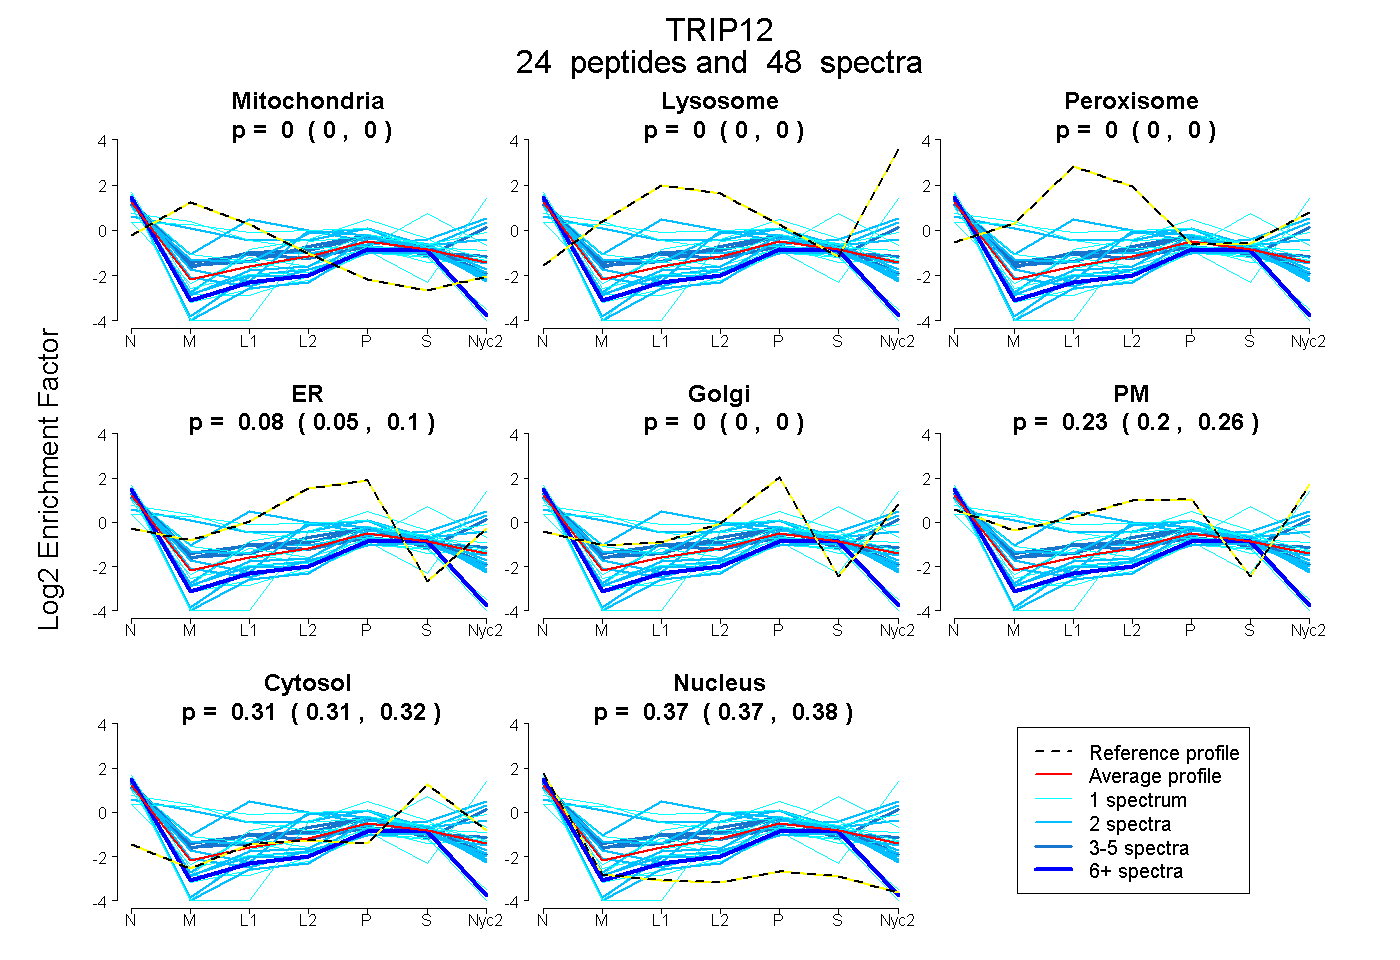
0.000 | 0.000
0.000 | 0.000
0.000 | 0.000
0.055 | 0.101
0.000 | 0.000
0.205 | 0.256
0.306 | 0.317
0.368 | 0.379
3peptides
spectra
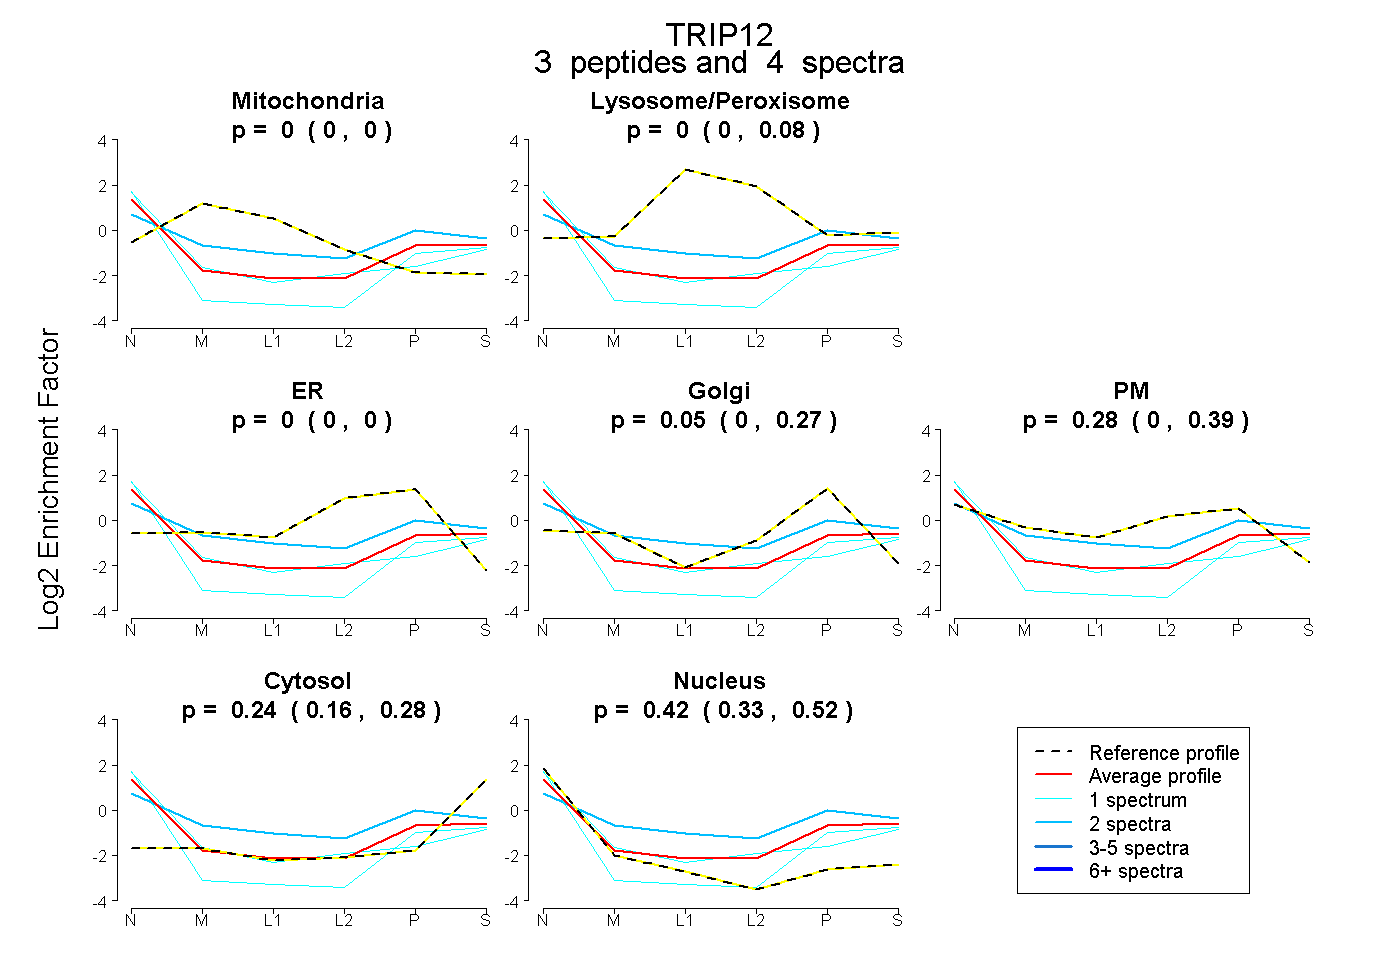
0.000 | 0.000
0.000 | 0.083
0.000 | 0.000
0.000 | 0.266
0.000 | 0.393
0.160 | 0.283
0.332 | 0.520
1peptide
spectrum
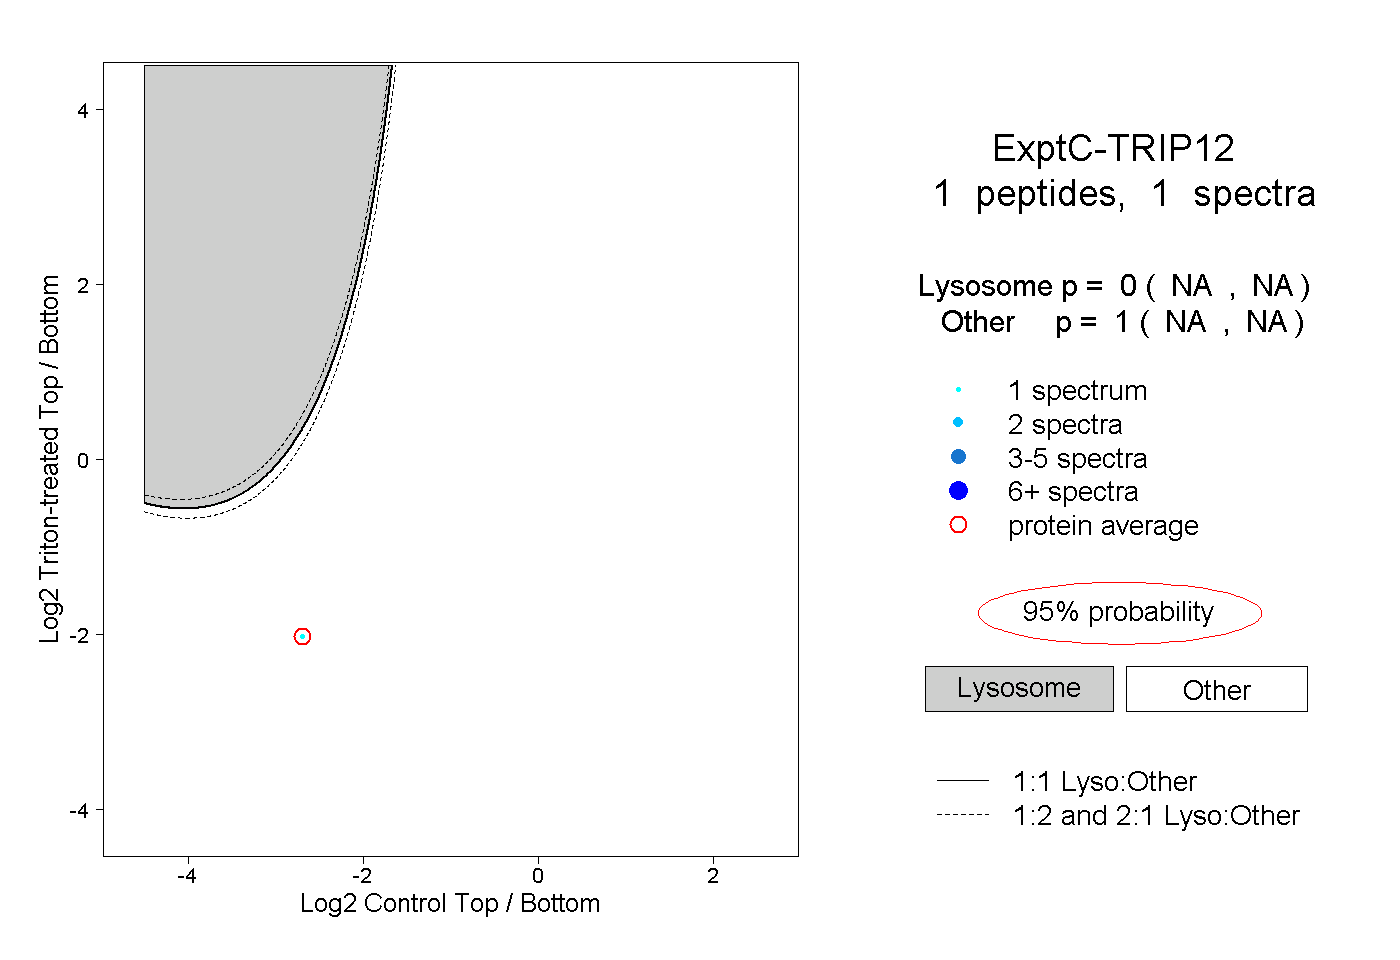
NA | NA
NA | NA