 24
24peptides
spectra
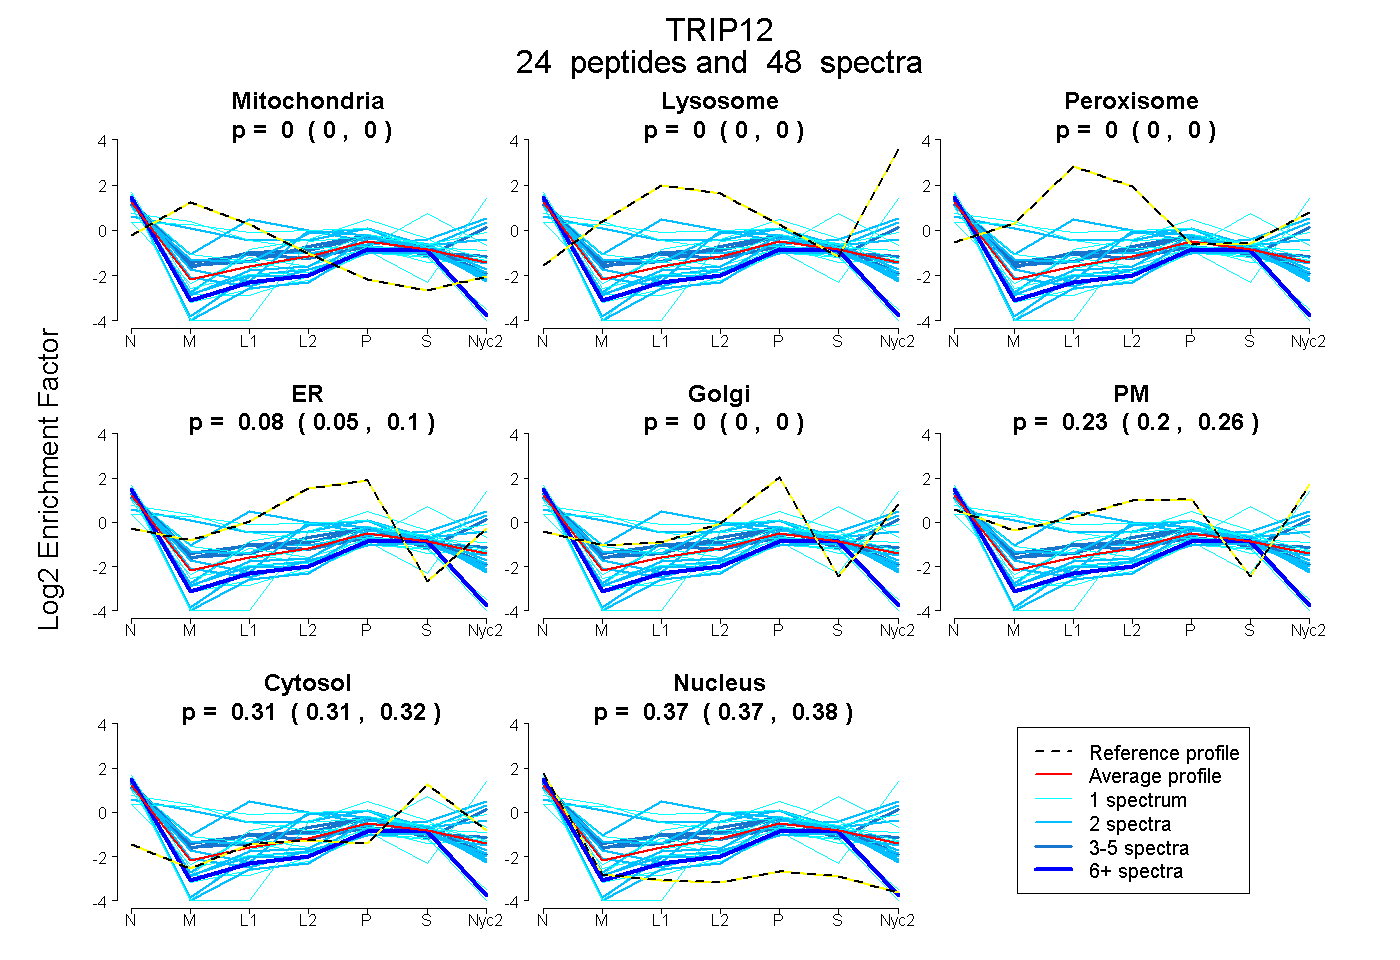
0.000 | 0.000
0.000 | 0.000
0.000 | 0.000
0.055 | 0.101
0.000 | 0.000
0.205 | 0.256
0.306 | 0.317
0.368 | 0.379
| Plot | Mito | Lyso | Perox | ER | Golgi | PM | Cytosol | Nucleus | |||||
| Expt A |
24 peptides |
48 spectra |
|
0.000 0.000 | 0.000 |
0.000 0.000 | 0.000 |
0.000 0.000 | 0.000 |
0.081 0.055 | 0.101 |
0.000 0.000 | 0.000 |
0.232 0.205 | 0.256 |
0.312 0.306 | 0.317 |
0.374 0.368 | 0.379 |
| 3 spectra, DTISNNR | 0.000 | 0.000 | 0.111 | 0.000 | 0.000 | 0.290 | 0.209 | 0.390 | ||
| 2 spectra, ADLGLWR | 0.000 | 0.000 | 0.340 | 0.000 | 0.000 | 0.334 | 0.148 | 0.177 | ||
| 1 spectrum, QLLLYLTSK | 0.085 | 0.000 | 0.000 | 0.000 | 0.000 | 0.286 | 0.267 | 0.362 | ||
| 2 spectra, GLWHPYNR | 0.000 | 0.000 | 0.000 | 0.053 | 0.000 | 0.454 | 0.303 | 0.190 | ||
| 1 spectrum, SLNPPLTIVR | 0.000 | 0.000 | 0.000 | 0.000 | 0.308 | 0.000 | 0.357 | 0.335 | ||
| 1 spectrum, HLDQEQQLK | 0.000 | 0.000 | 0.000 | 0.397 | 0.000 | 0.000 | 0.368 | 0.236 | ||
| 1 spectrum, IIYFADAELLK | 0.000 | 0.000 | 0.000 | 0.000 | 0.000 | 0.163 | 0.693 | 0.143 | ||
| 4 spectra, GLPPHLFGPLGPR | 0.000 | 0.000 | 0.130 | 0.259 | 0.000 | 0.000 | 0.244 | 0.368 | ||
| 2 spectra, LQALLEAR | 0.000 | 0.000 | 0.000 | 0.000 | 0.105 | 0.000 | 0.322 | 0.573 | ||
| 1 spectrum, LLDTNPEINQSDSQDSR | 0.000 | 0.000 | 0.000 | 0.073 | 0.000 | 0.000 | 0.203 | 0.724 | ||
| 2 spectra, LSDVLK | 0.000 | 0.000 | 0.000 | 0.000 | 0.182 | 0.000 | 0.363 | 0.455 | ||
| 1 spectrum, LSAQSNSNNIEPAR | 0.000 | 0.000 | 0.000 | 0.039 | 0.200 | 0.021 | 0.385 | 0.355 | ||
| 2 spectra, SVESTCLCFAR | 0.000 | 0.000 | 0.000 | 0.000 | 0.042 | 0.163 | 0.277 | 0.519 | ||
| 2 spectra, HPDCANVK | 0.000 | 0.000 | 0.000 | 0.387 | 0.000 | 0.000 | 0.247 | 0.366 | ||
| 7 spectra, VLHAISR | 0.000 | 0.000 | 0.000 | 0.090 | 0.000 | 0.000 | 0.260 | 0.650 | ||
| 2 spectra, LVDLPLGLPFYK | 0.000 | 0.000 | 0.000 | 0.105 | 0.000 | 0.040 | 0.337 | 0.518 | ||
| 2 spectra, EDPELAK | 0.000 | 0.000 | 0.000 | 0.000 | 0.000 | 0.398 | 0.422 | 0.181 | ||
| 1 spectrum, LPDIFSVYFR | 0.473 | 0.000 | 0.000 | 0.008 | 0.000 | 0.278 | 0.133 | 0.108 | ||
| 1 spectrum, SVAAGSSR | 0.000 | 0.000 | 0.000 | 0.000 | 0.000 | 0.524 | 0.070 | 0.406 | ||
| 2 spectra, EIIPTSEFINSK | 0.340 | 0.000 | 0.001 | 0.314 | 0.000 | 0.073 | 0.200 | 0.072 | ||
| 2 spectra, TAGVSGLAR | 0.000 | 0.000 | 0.000 | 0.133 | 0.146 | 0.000 | 0.260 | 0.461 | ||
| 1 spectrum, QFDSFR | 0.307 | 0.000 | 0.094 | 0.228 | 0.000 | 0.146 | 0.225 | 0.000 | ||
| 1 spectrum, IDPLALVQAIER | 0.000 | 0.000 | 0.000 | 0.080 | 0.000 | 0.000 | 0.221 | 0.700 | ||
| 4 spectra, FFNTHQLK | 0.000 | 0.000 | 0.000 | 0.000 | 0.000 | 0.521 | 0.222 | 0.256 |
| Plot | Mito | Lyso or Perox | ER | Golgi | PM | Cytosol | Nucleus | ||||||
| Expt B |
3 peptides |
4 spectra |
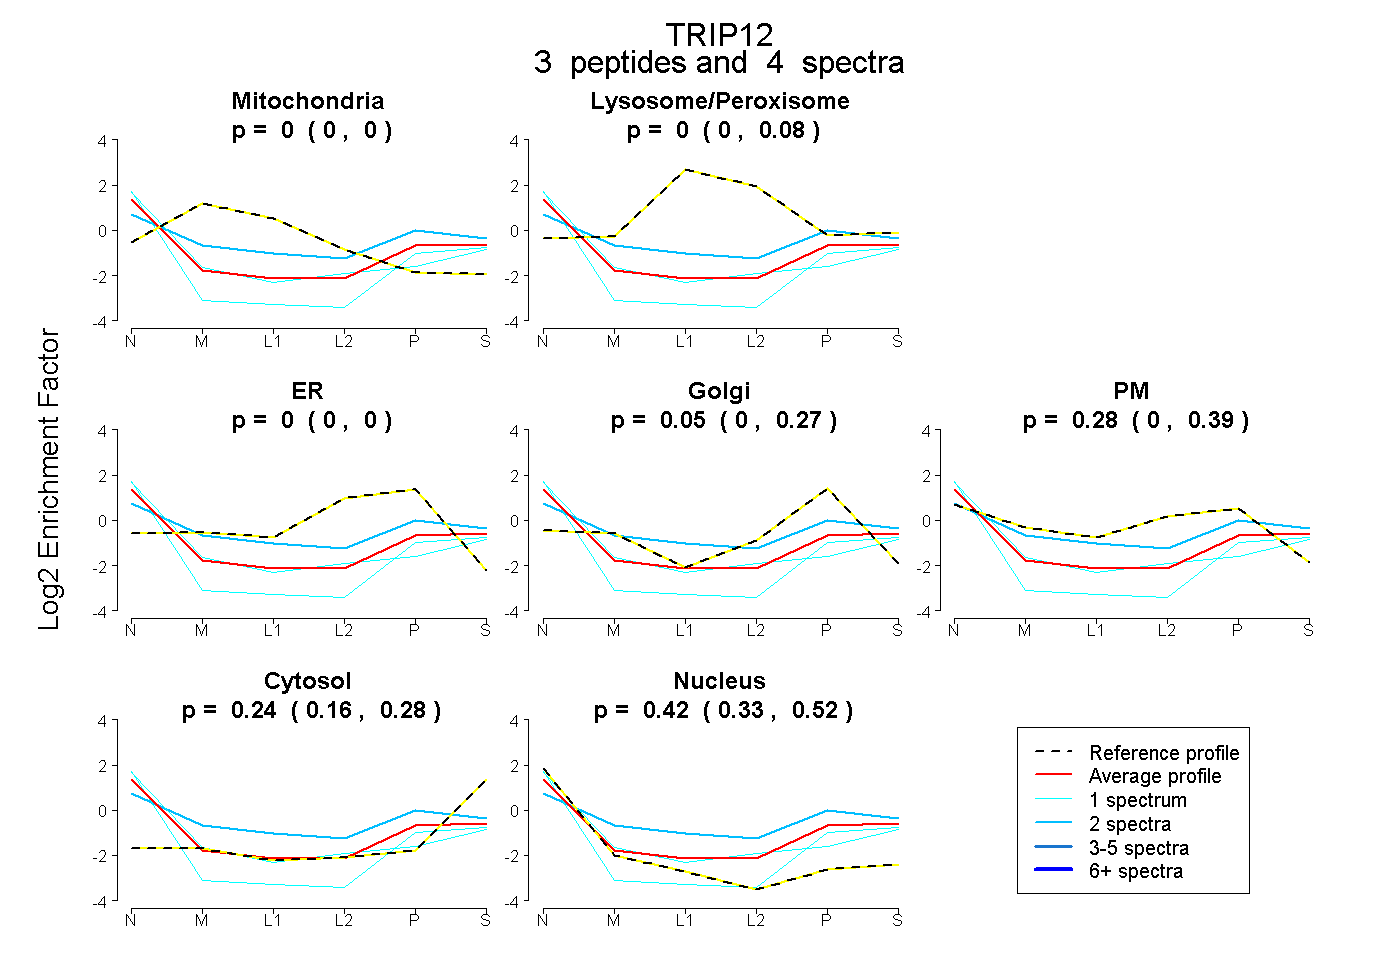 |
0.000 0.000 | 0.000 |
0.000 0.000 | 0.083 |
0.000 0.000 | 0.000 |
0.054 0.000 | 0.266 |
0.283 0.000 | 0.393 |
0.238 0.160 | 0.283 |
0.424 0.332 | 0.520 |
|||
| Plot | Lyso | Other | |||||||||||
| Expt C |
1 peptide |
1 spectrum |
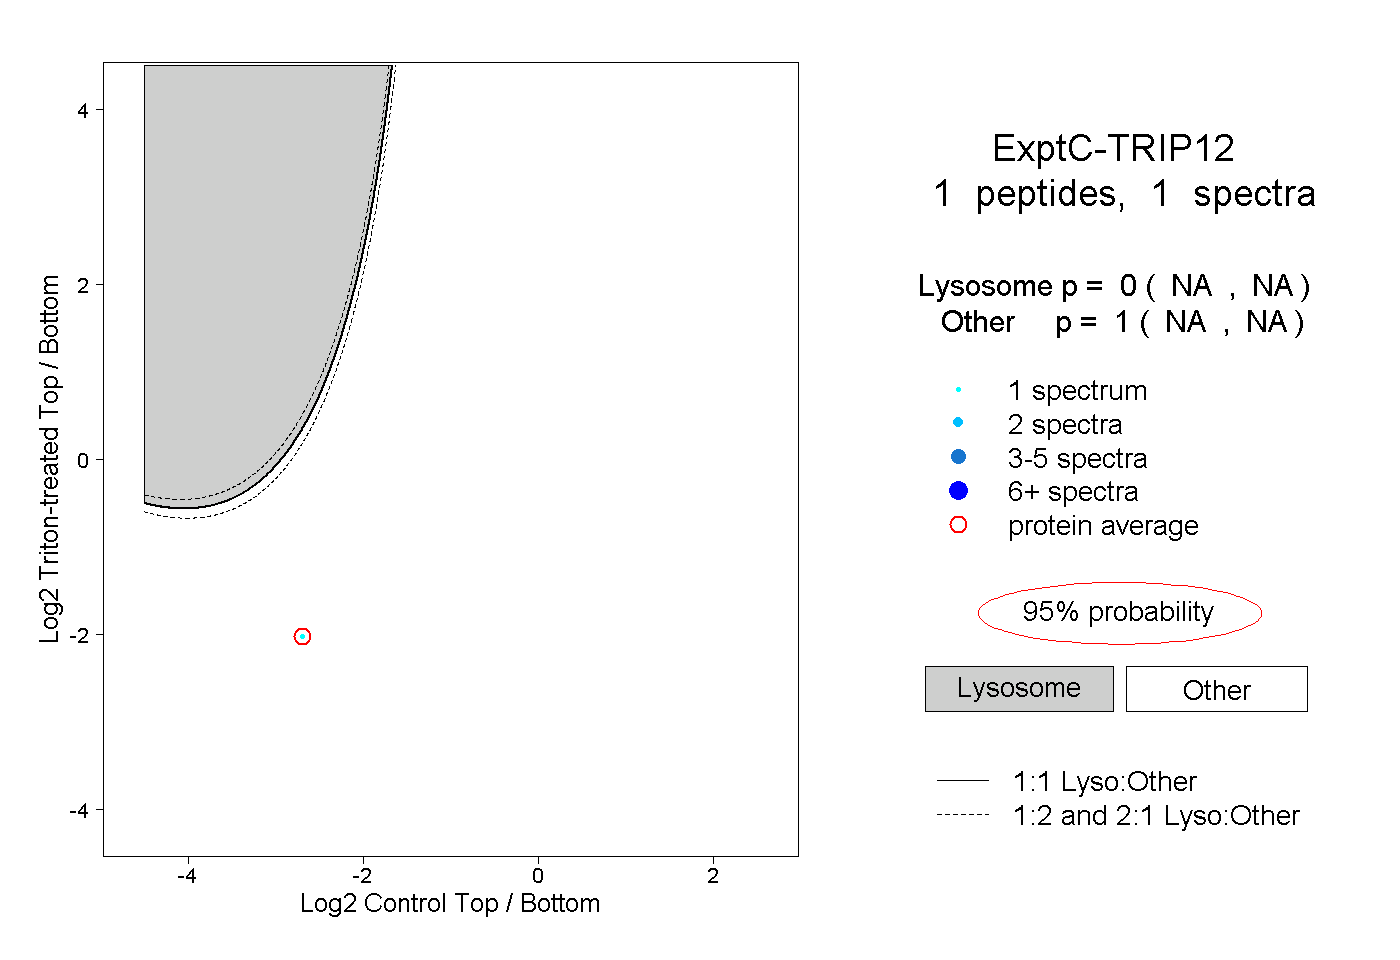 |
0.000 NA | NA |
1.000 NA | NA |