 10
10peptides
spectra
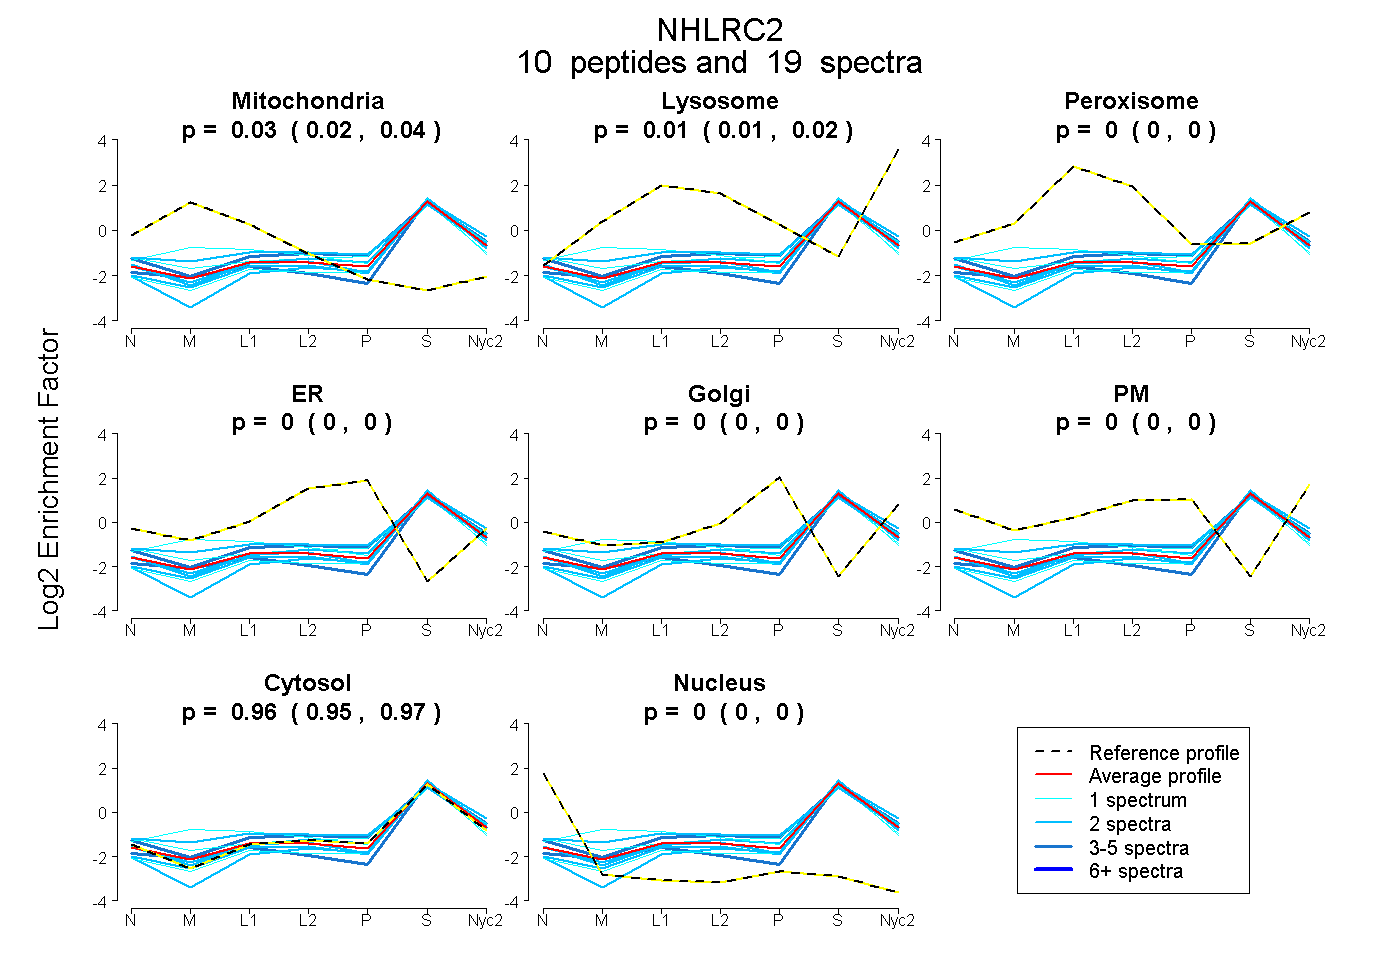
0.016 | 0.036
0.005 | 0.017
0.000 | 0.000
0.000 | 0.000
0.000 | 0.000
0.000 | 0.000
0.949 | 0.971
0.000 | 0.000
3peptides
spectra
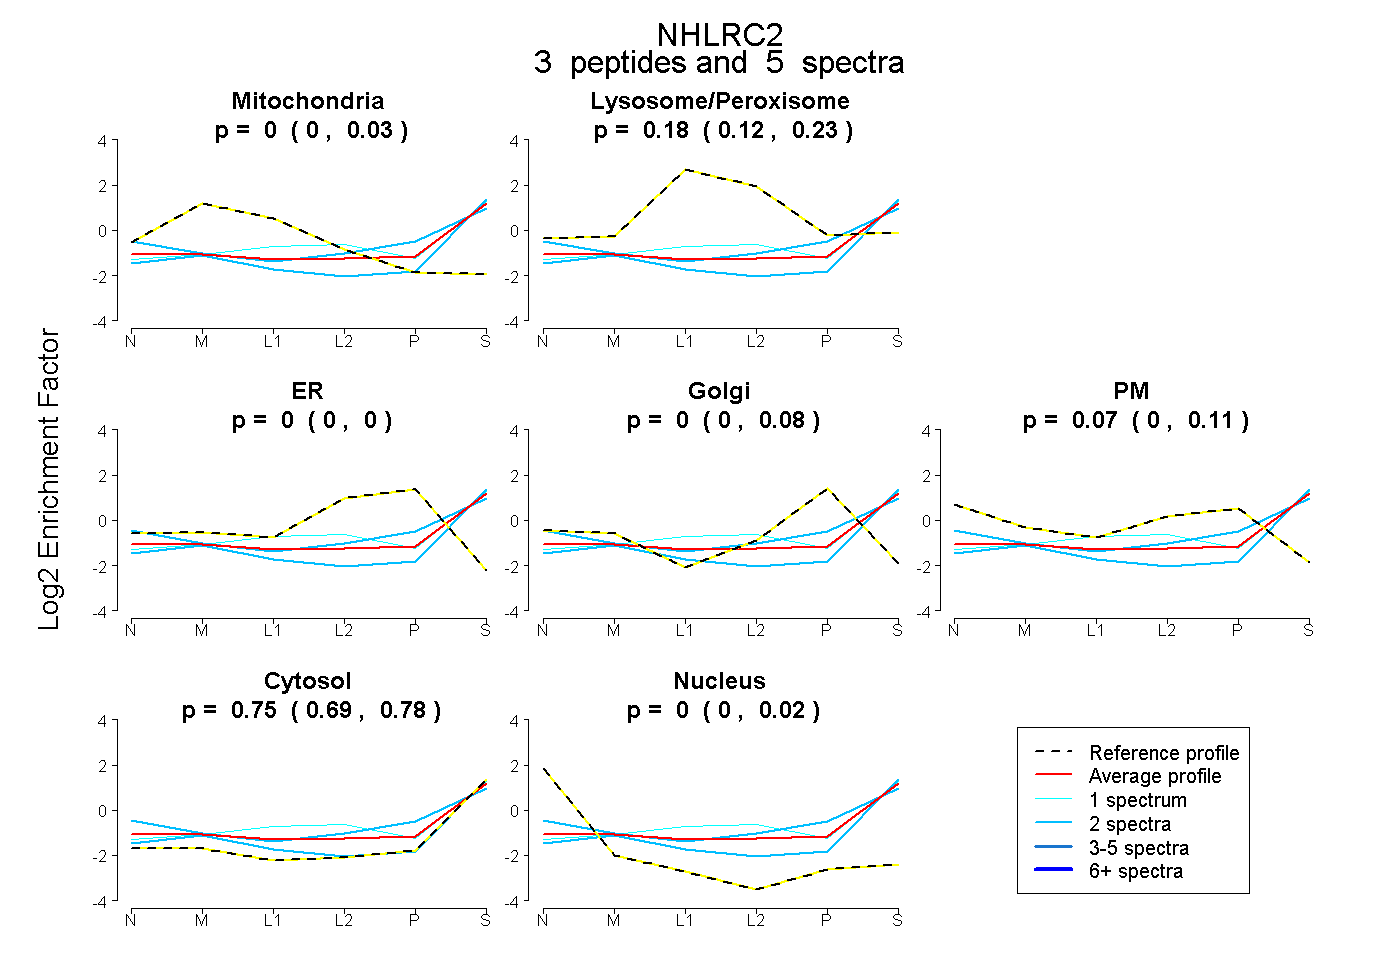
0.000 | 0.030
0.123 | 0.234
0.000 | 0.000
0.000 | 0.082
0.000 | 0.115
0.694 | 0.783
0.000 | 0.016
9peptides
spectra
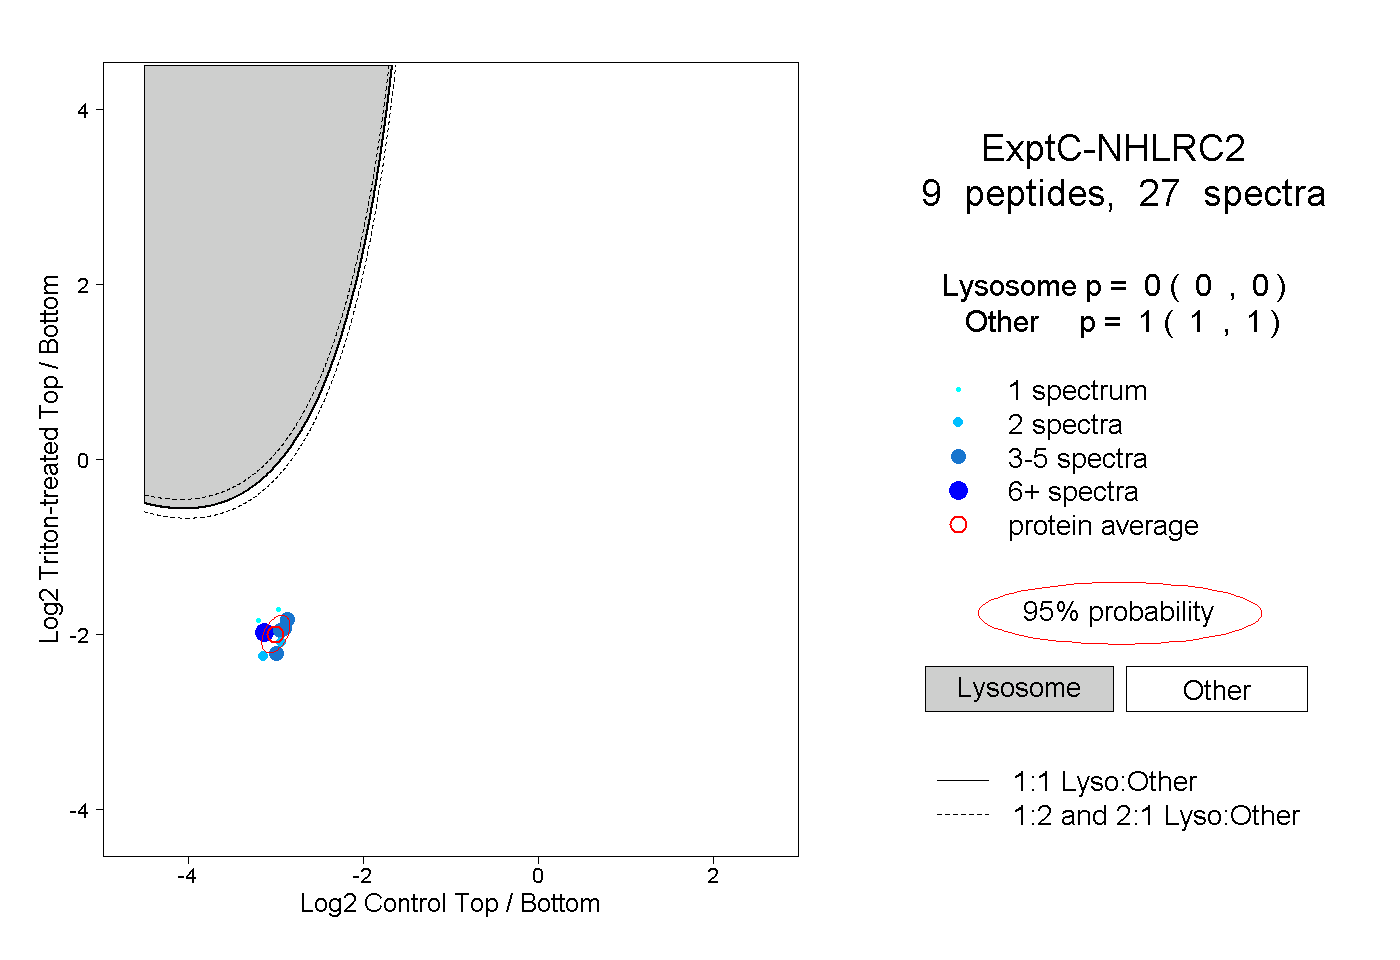
0.000 | 0.000
1.000 | 1.000
1peptide
spectrum
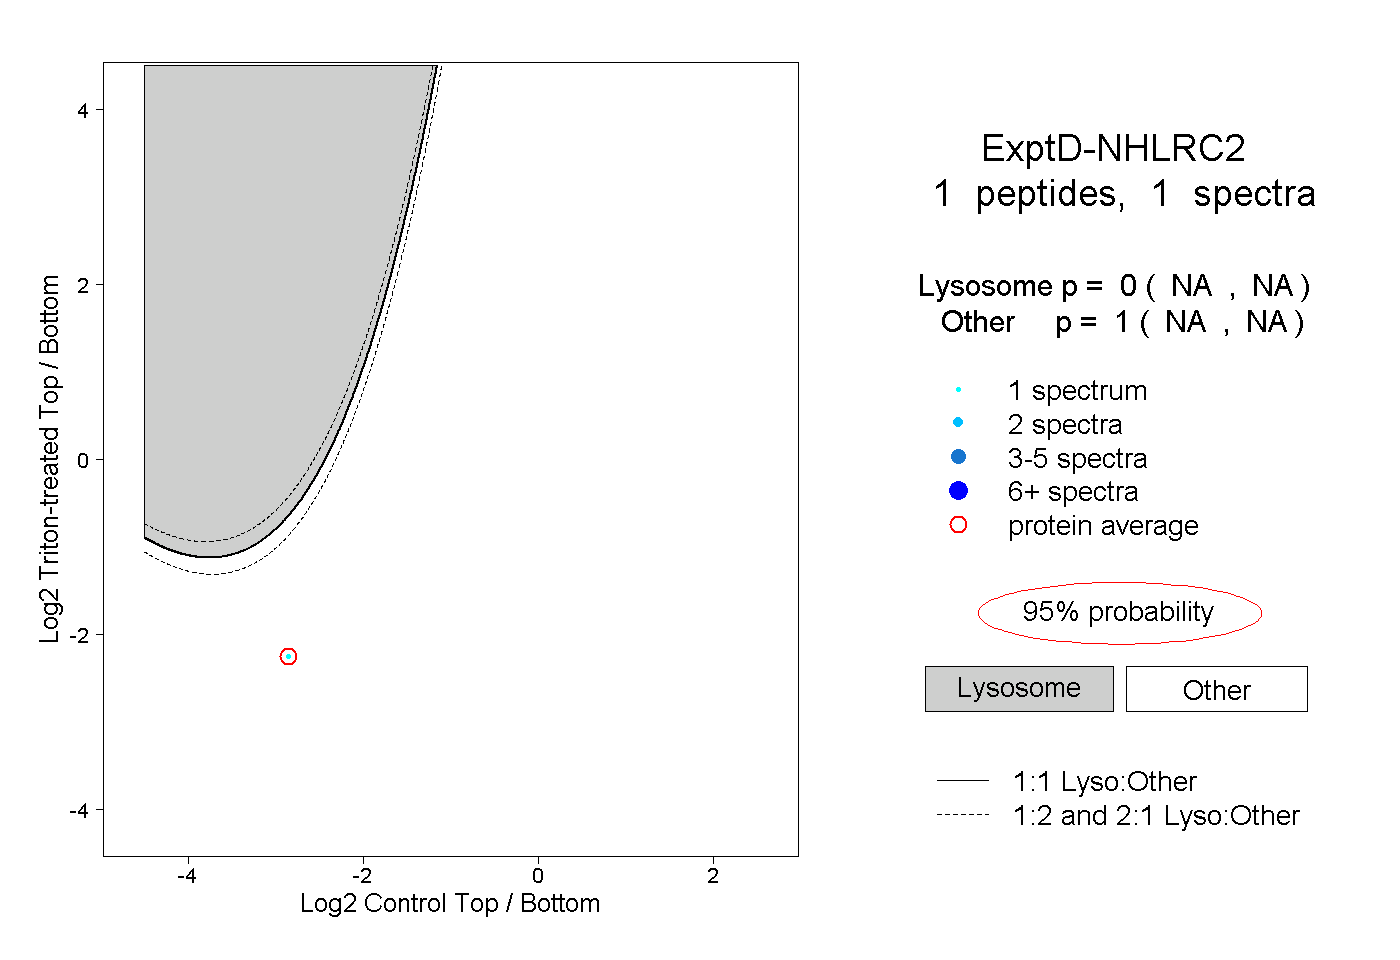
NA | NA
NA | NA