 10
10peptides
spectra
0.016 | 0.036
0.005 | 0.017
0.000 | 0.000
0.000 | 0.000
0.000 | 0.000
0.000 | 0.000
0.949 | 0.971
0.000 | 0.000
| Plot | Mito | Lyso | Perox | ER | Golgi | PM | Cytosol | Nucleus | |||||
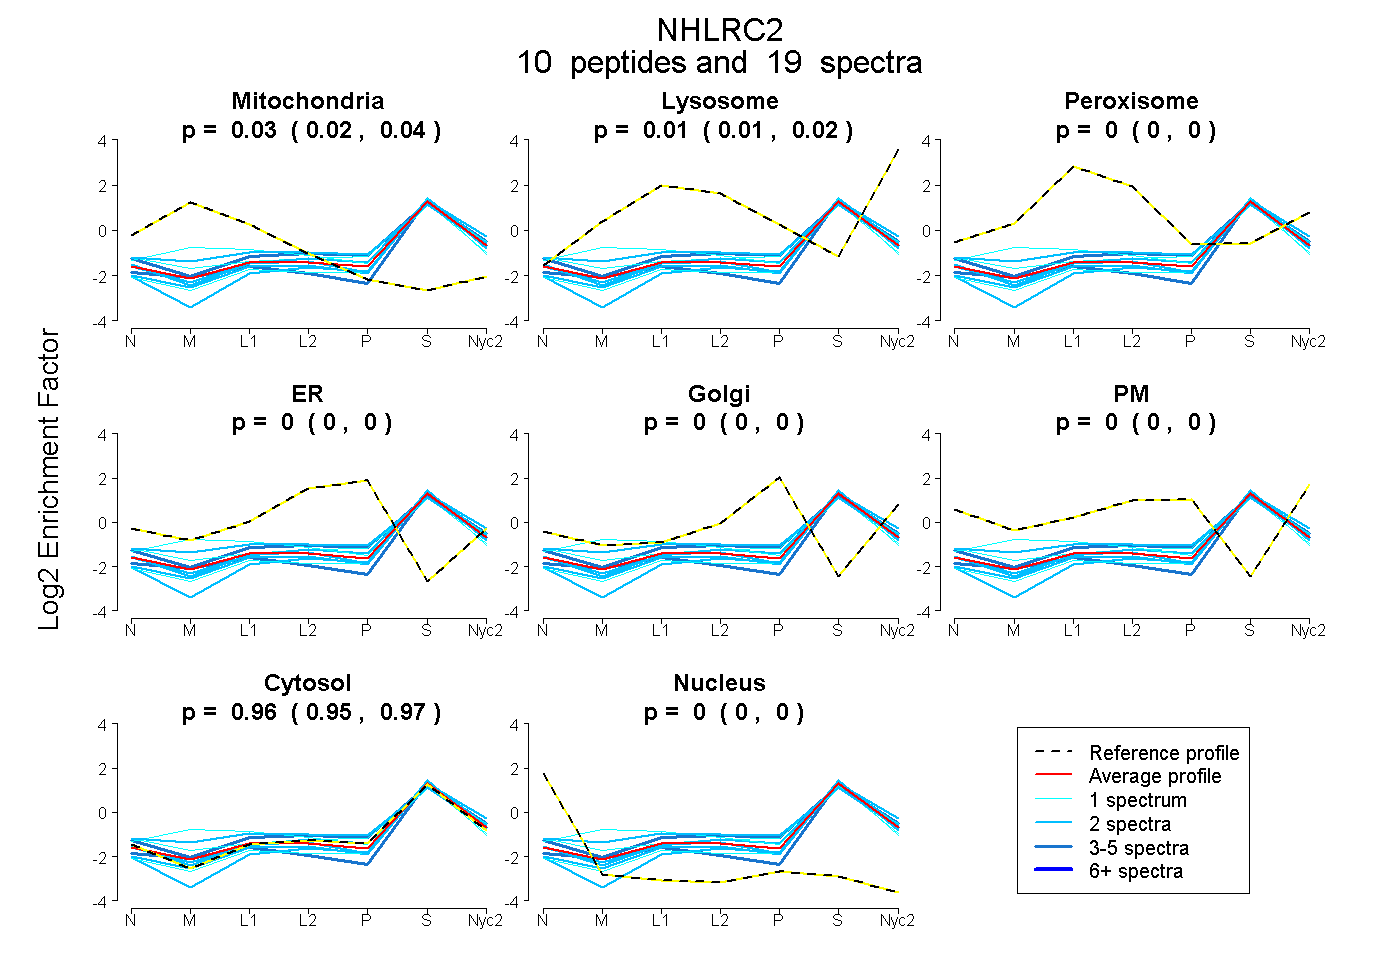
| Expt A |
10 peptides |
19 spectra |
|
0.027 0.016 | 0.036 |
0.011 0.005 | 0.017 |
0.000 0.000 | 0.000 |
0.000 0.000 | 0.000 |
0.000 0.000 | 0.000 |
0.000 0.000 | 0.000 |
0.962 0.949 | 0.971 |
0.000 0.000 | 0.000 |
| 1 spectrum, NNAYPHK | 0.090 | 0.000 | 0.011 | 0.000 | 0.015 | 0.000 | 0.884 | 0.000 | ||
| 3 spectra, FAGSGNEENR | 0.000 | 0.048 | 0.040 | 0.000 | 0.000 | 0.014 | 0.897 | 0.000 | ||
| 2 spectra, VVDPNTK | 0.079 | 0.037 | 0.081 | 0.000 | 0.000 | 0.000 | 0.803 | 0.000 | ||
| 1 spectrum, SAPNISLPPVTVHPGQALQLGLR | 0.000 | 0.000 | 0.000 | 0.000 | 0.000 | 0.000 | 0.998 | 0.002 | ||
| 2 spectra, VAADPTTGR | 0.006 | 0.000 | 0.000 | 0.000 | 0.000 | 0.000 | 0.994 | 0.000 | ||
| 2 spectra, SDSAVVDGSFPR | 0.000 | 0.052 | 0.000 | 0.000 | 0.000 | 0.000 | 0.948 | 0.000 | ||
| 3 spectra, GNLLFSLIGEGHK | 0.028 | 0.000 | 0.000 | 0.000 | 0.000 | 0.000 | 0.972 | 0.000 | ||
| 2 spectra, ILVLQK | 0.000 | 0.000 | 0.000 | 0.000 | 0.000 | 0.000 | 1.000 | 0.000 | ||
| 2 spectra, LLYVADTNNHQIK | 0.000 | 0.000 | 0.000 | 0.000 | 0.000 | 0.000 | 1.000 | 0.000 | ||
| 1 spectrum, TVSVLPVFK | 0.166 | 0.097 | 0.010 | 0.000 | 0.000 | 0.000 | 0.727 | 0.000 |
| Plot | Mito | Lyso or Perox | ER | Golgi | PM | Cytosol | Nucleus | ||||||
| Expt B |
3 peptides |
5 spectra |
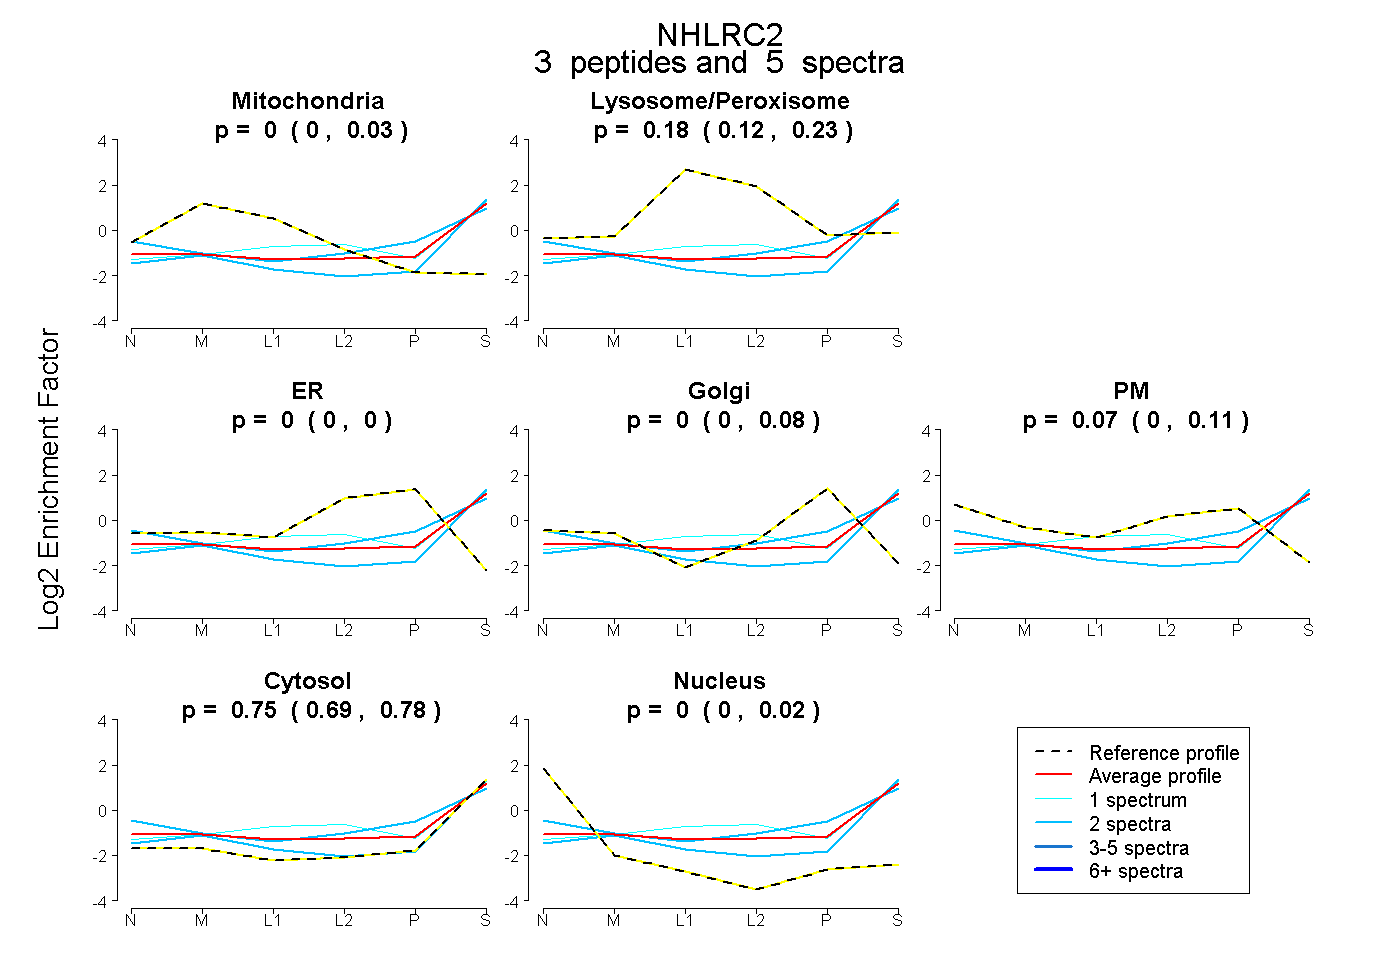 |
0.000 0.000 | 0.030 |
0.178 0.123 | 0.234 |
0.000 0.000 | 0.000 |
0.000 0.000 | 0.082 |
0.072 0.000 | 0.115 |
0.750 0.694 | 0.783 |
0.000 0.000 | 0.016 |
|||
| Plot | Lyso | Other | |||||||||||
| Expt C |
9 peptides |
27 spectra |
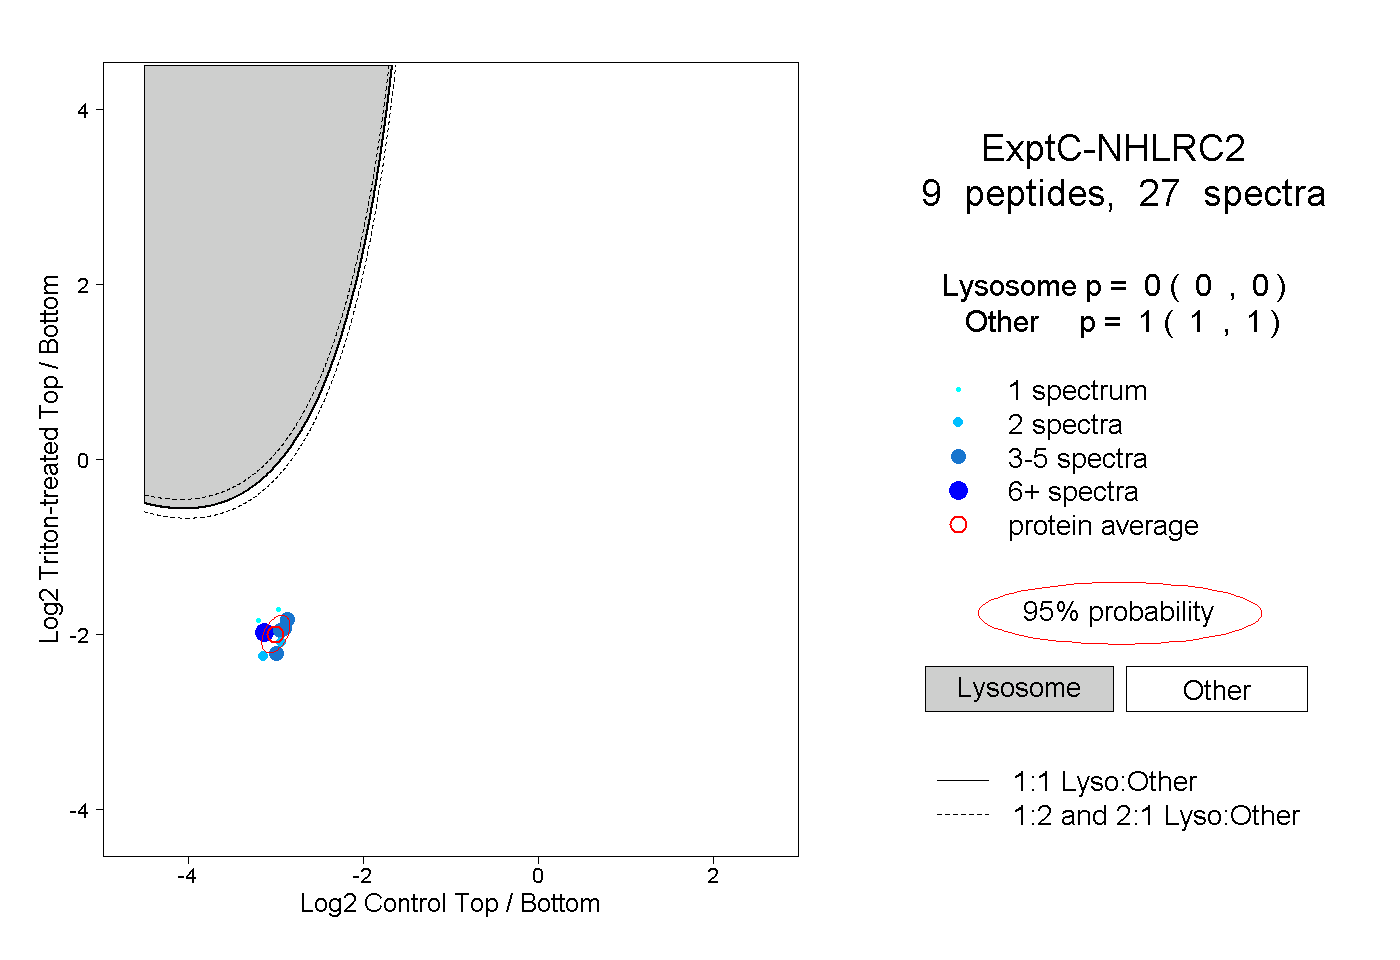 |
0.000 0.000 | 0.000 |
1.000 1.000 | 1.000 |
||||||||
| Plot | Lyso | Other | |||||||||||
| Expt D |
1 peptide |
1 spectrum |
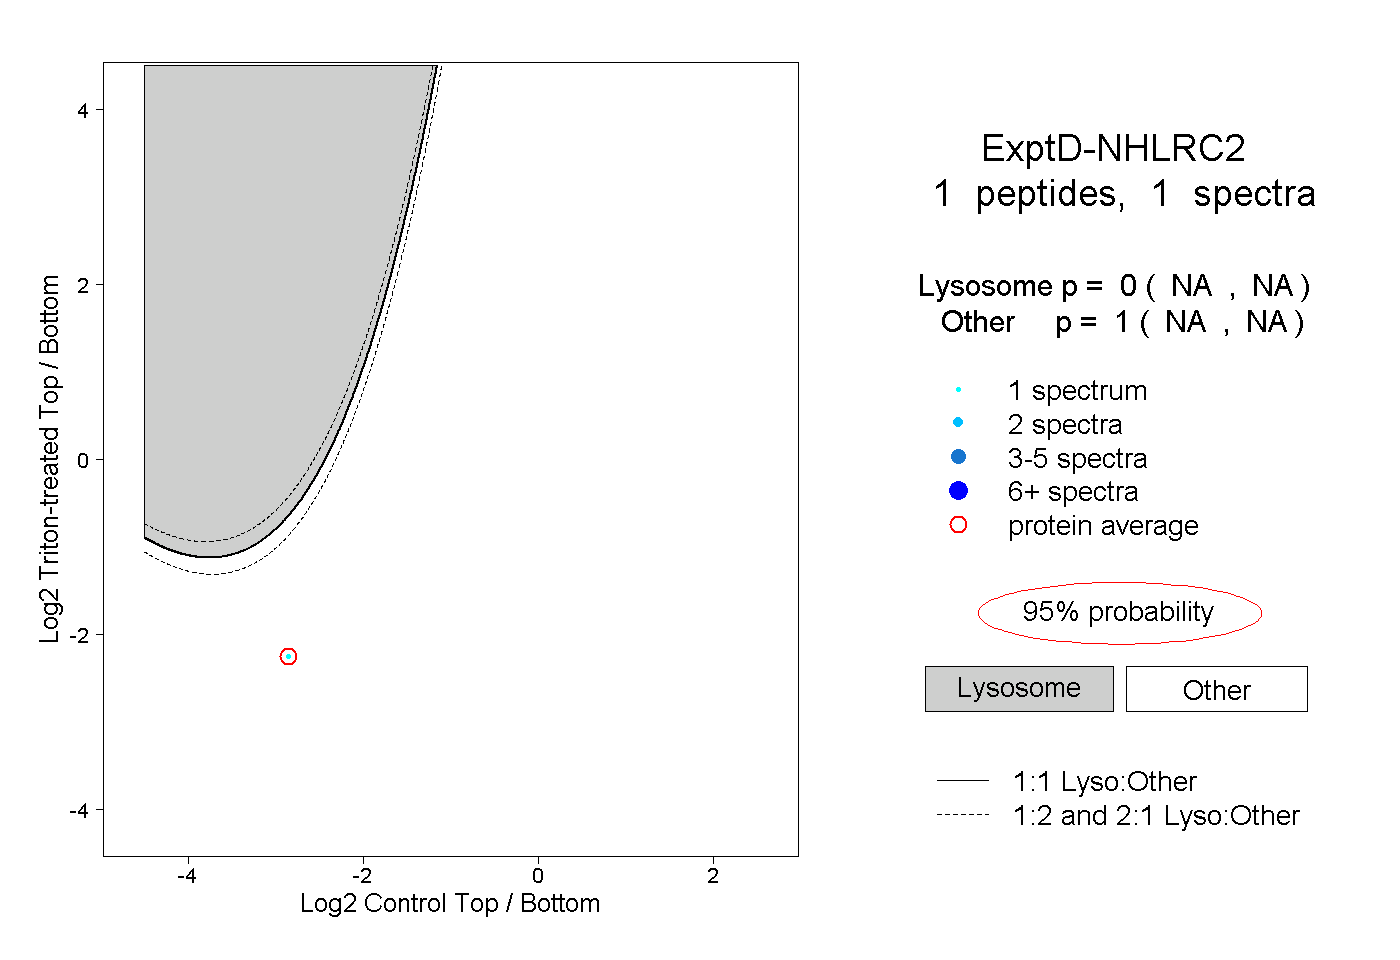 |
0.000 NA | NA |
1.000 NA | NA |