 7
7peptides
spectra
0.000 | 0.002
0.109 | 0.162
0.000 | 0.000
0.000 | 0.000
0.000 | 0.021
0.000 | 0.025
0.827 | 0.867
0.000 | 0.000
4peptides
spectra

0.000 | 0.000
1.000 | 1.000
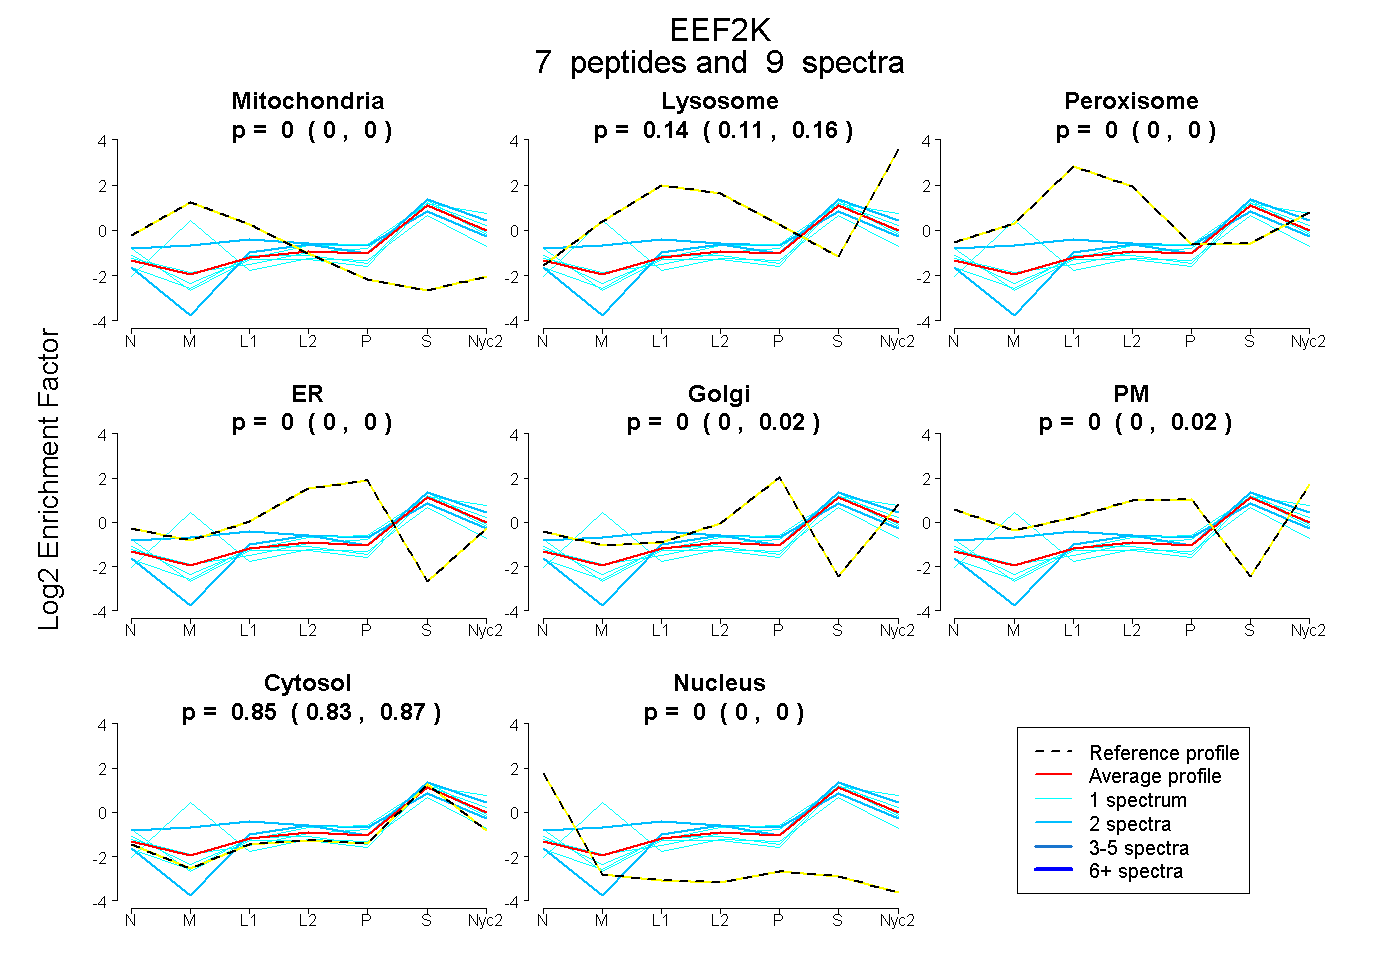
| Plot | Mito | Lyso | Perox | ER | Golgi | PM | Cytosol | Nucleus | |||||
| Expt A |
7 peptides |
9 spectra |
|
0.000 0.000 | 0.002 |
0.144 0.109 | 0.162 |
0.000 0.000 | 0.000 |
0.000 0.000 | 0.000 |
0.005 0.000 | 0.021 |
0.000 0.000 | 0.025 |
0.851 0.827 | 0.867 |
0.000 0.000 | 0.000 |
||
| Plot | Lyso | Other | |||||||||||
| Expt C |
4 peptides |
7 spectra |
|
0.000 0.000 | 0.000 |
1.000 1.000 | 1.000 |