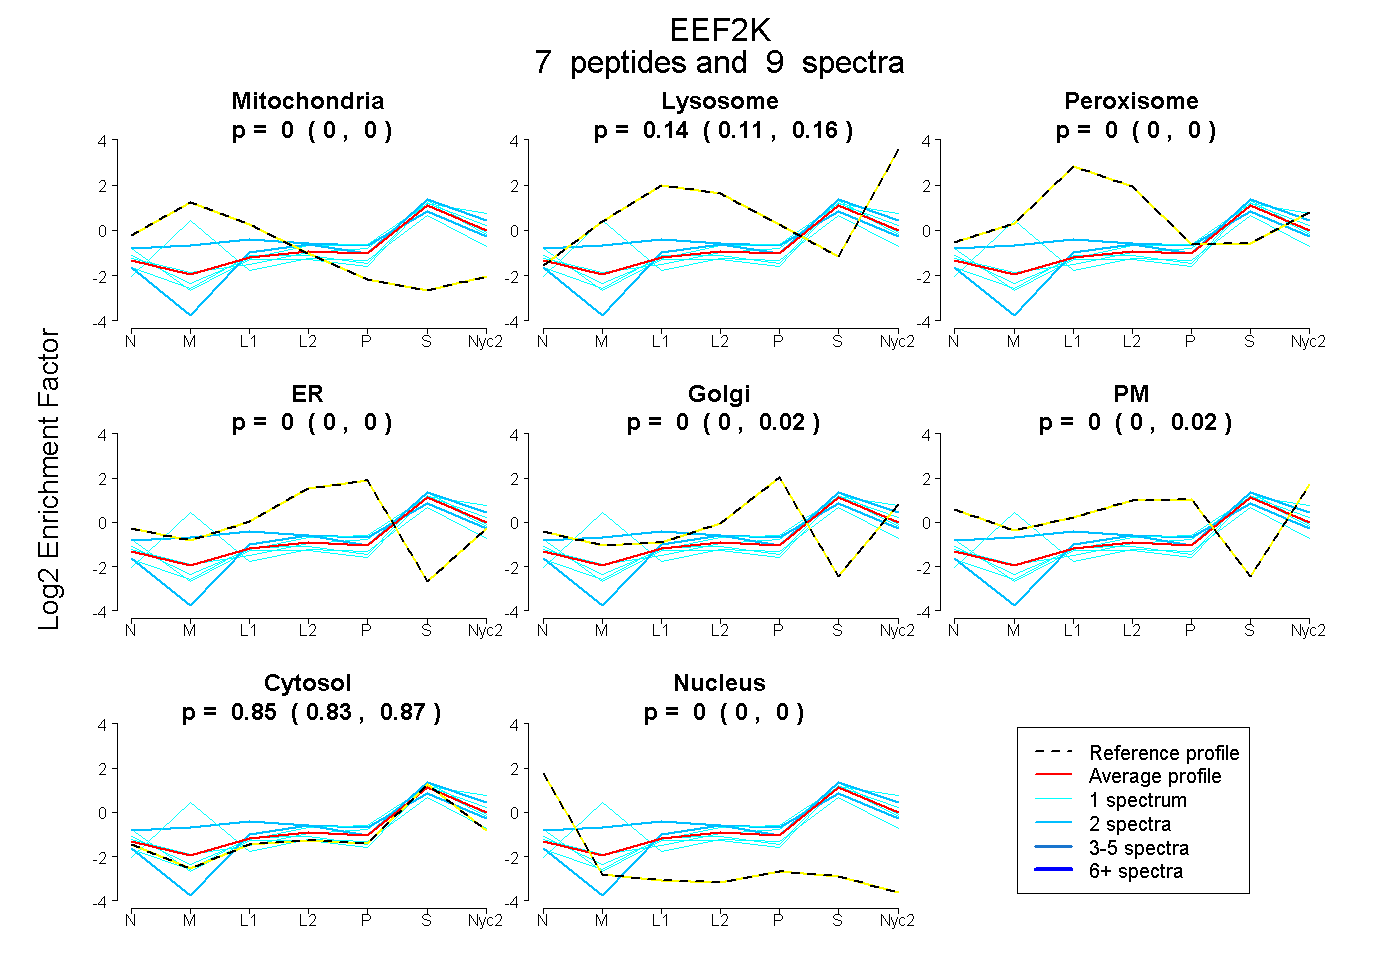
 7
7peptides
spectra
0.000 | 0.002
0.109 | 0.162
0.000 | 0.000
0.000 | 0.000
0.000 | 0.021
0.000 | 0.025
0.827 | 0.867
0.000 | 0.000
| Plot | Mito | Lyso | Perox | ER | Golgi | PM | Cytosol | Nucleus | |||||
| Expt A |
7 peptides |
9 spectra |
|
0.000 0.000 | 0.002 |
0.144 0.109 | 0.162 |
0.000 0.000 | 0.000 |
0.000 0.000 | 0.000 |
0.005 0.000 | 0.021 |
0.000 0.000 | 0.025 |
0.851 0.827 | 0.867 |
0.000 0.000 | 0.000 |
| 1 spectrum, VHLAMVR | 0.298 | 0.065 | 0.000 | 0.000 | 0.000 | 0.000 | 0.636 | 0.000 | ||
| 1 spectrum, QSMILVAR | 0.000 | 0.176 | 0.000 | 0.000 | 0.045 | 0.000 | 0.779 | 0.000 | ||
| 1 spectrum, GFDYLLK | 0.000 | 0.045 | 0.000 | 0.000 | 0.000 | 0.011 | 0.919 | 0.025 | ||
| 2 spectra, LTPQAFSHFTFER | 0.087 | 0.058 | 0.196 | 0.000 | 0.051 | 0.000 | 0.608 | 0.000 | ||
| 1 spectrum, AFDTGLNLSPDR | 0.000 | 0.079 | 0.000 | 0.000 | 0.000 | 0.000 | 0.921 | 0.000 | ||
| 1 spectrum, EAEMLLTGGFGLDK | 0.000 | 0.115 | 0.000 | 0.000 | 0.060 | 0.000 | 0.825 | 0.000 | ||
| 2 spectra, TLSGSRPPLLLR | 0.000 | 0.102 | 0.000 | 0.000 | 0.000 | 0.000 | 0.898 | 0.000 |
| Plot | Lyso | Other | |||||||||||
| Expt C |
4 peptides |
7 spectra |
 |
0.000 0.000 | 0.000 |
1.000 1.000 | 1.000 |