 4
4peptides
spectra
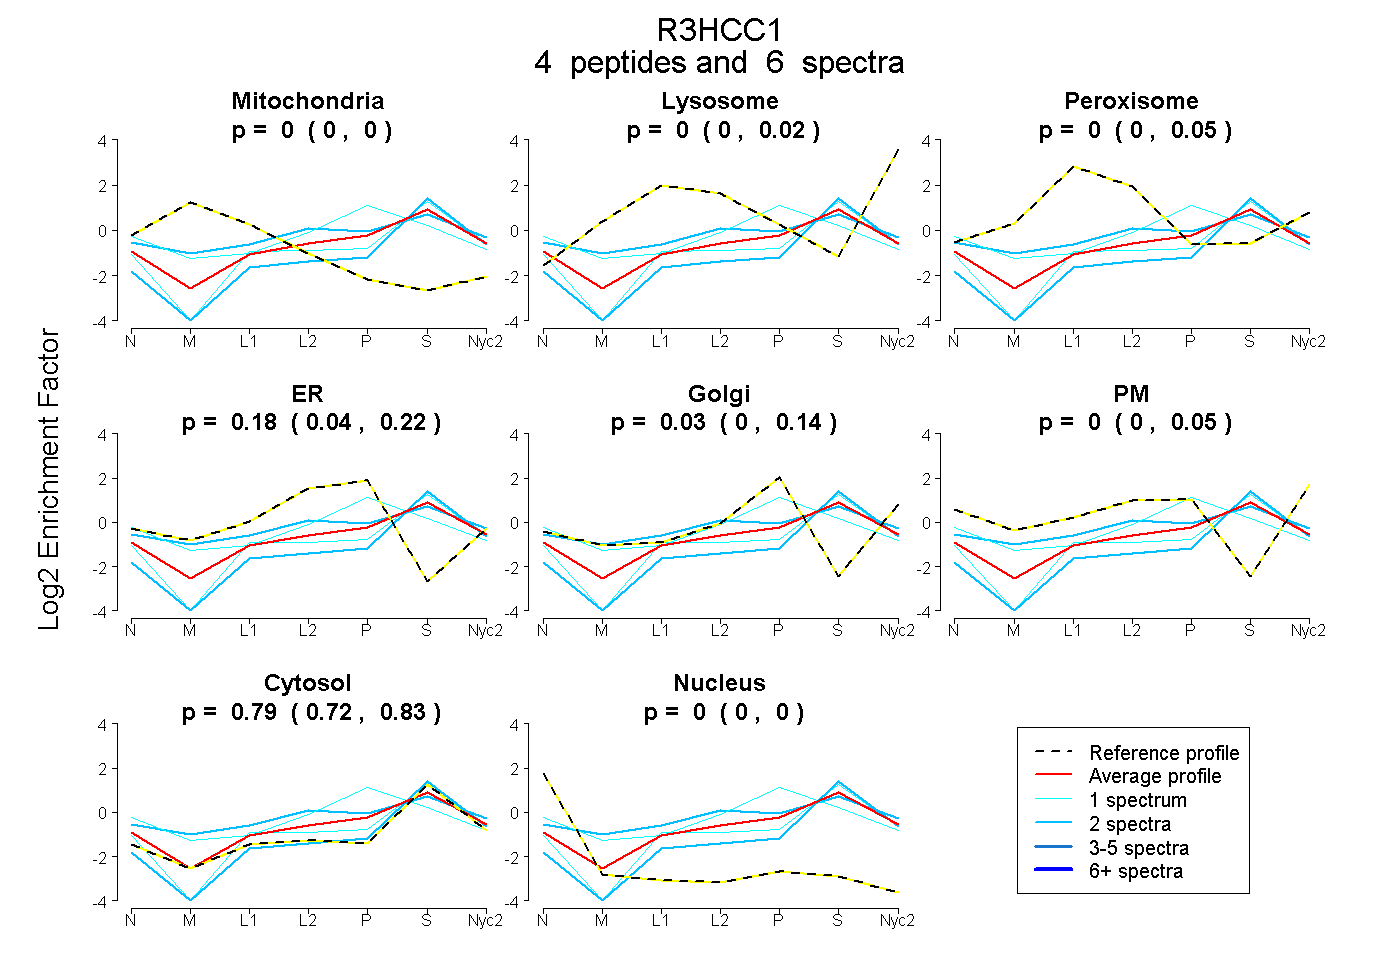
0.000 | 0.000
0.000 | 0.016
0.000 | 0.050
0.043 | 0.221
0.000 | 0.142
0.000 | 0.055
0.720 | 0.832
0.000 | 0.000
1peptide
spectra
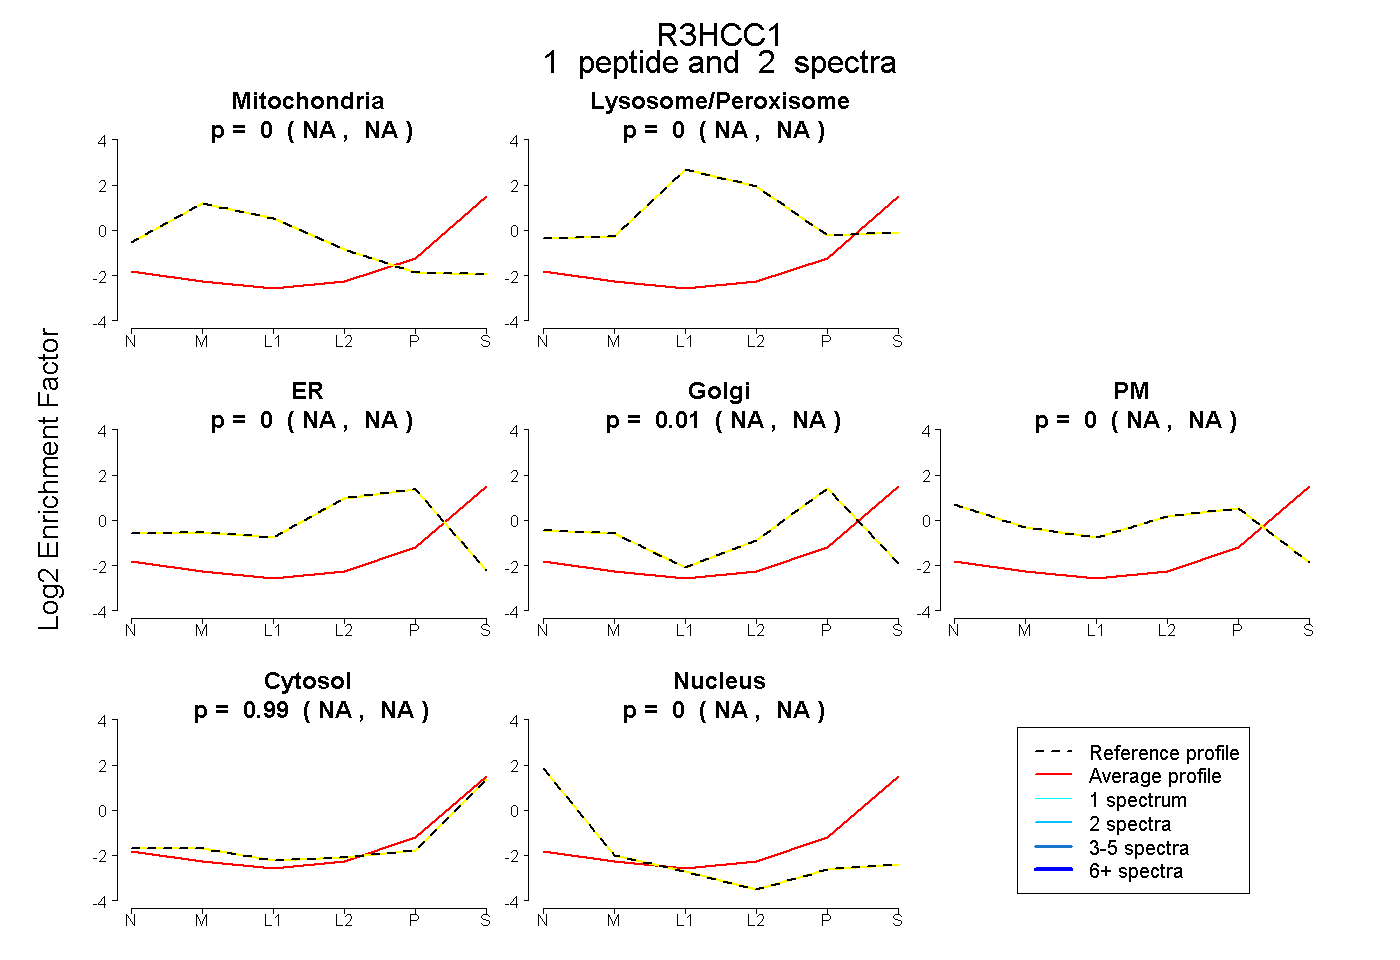
NA | NA
NA | NA
NA | NA
NA | NA
NA | NA
NA | NA
NA | NA
2peptides
spectra
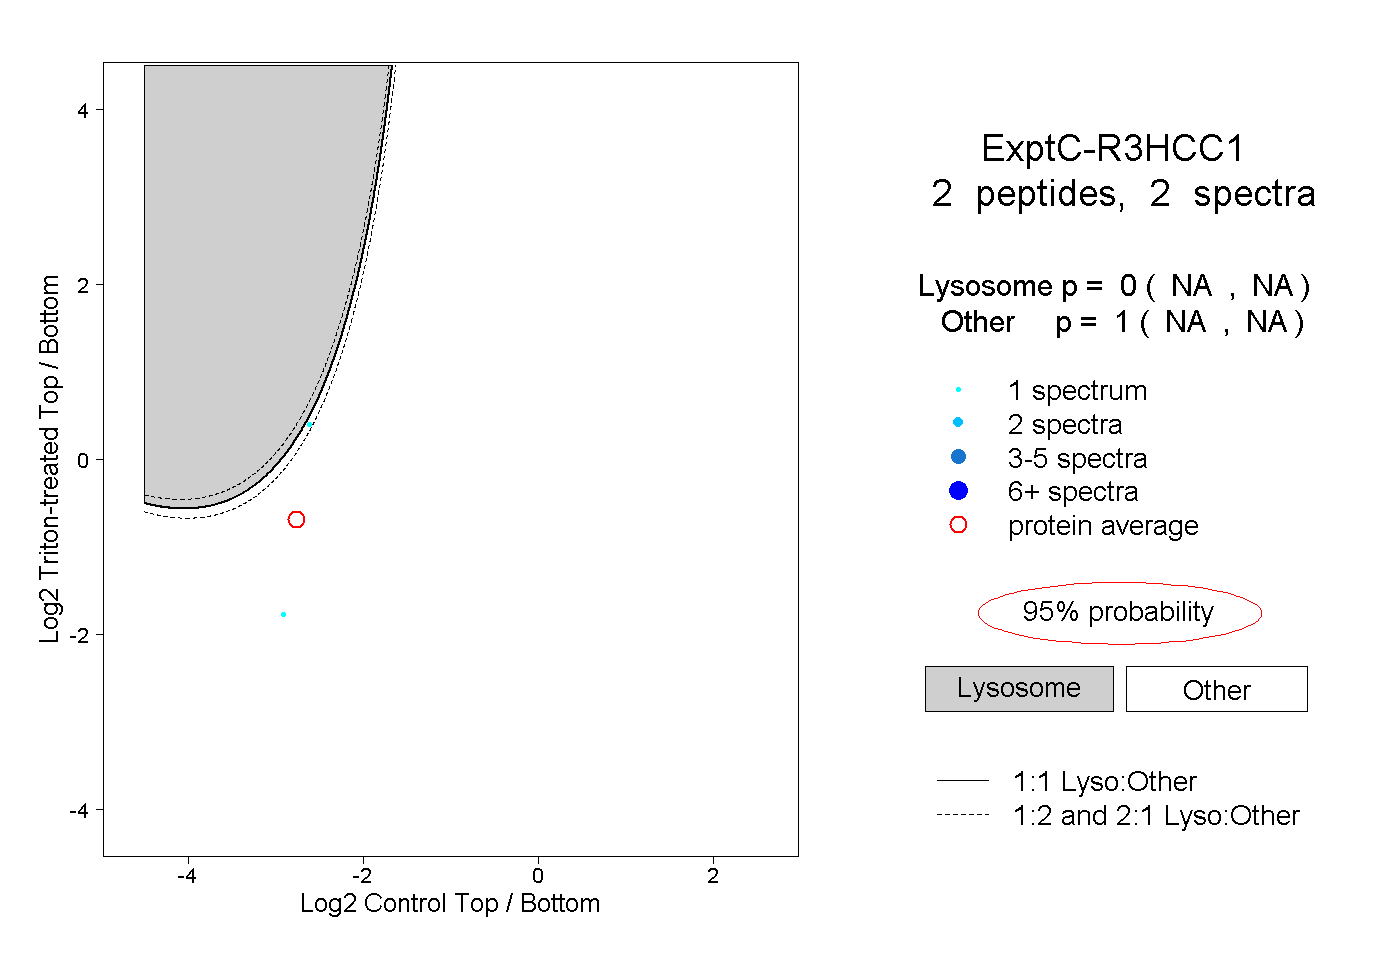
NA | NA
NA | NA