 4
4peptides
spectra
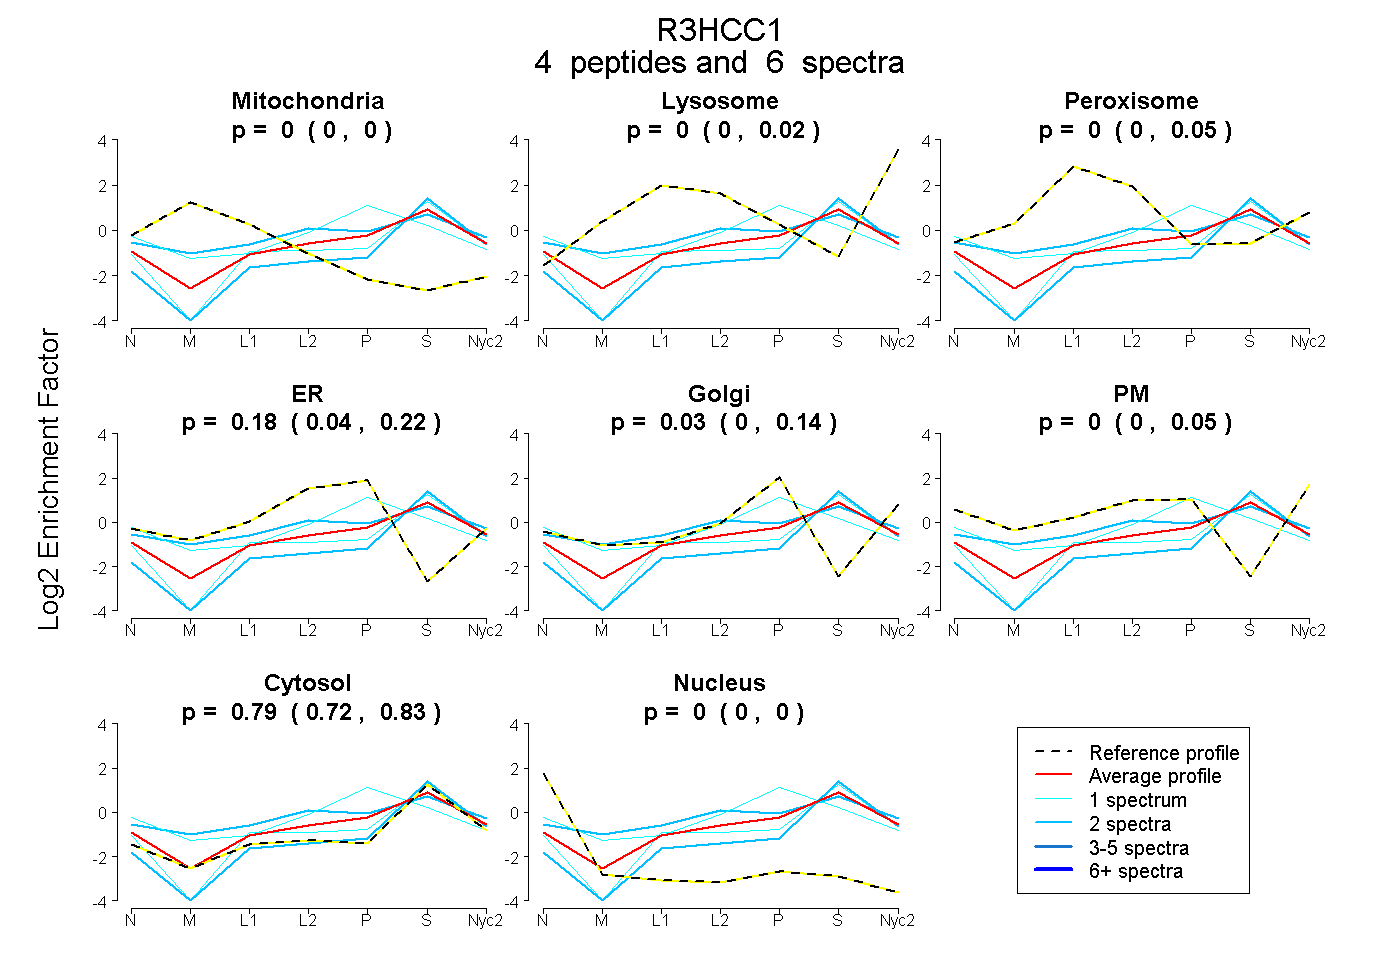
0.000 | 0.000
0.000 | 0.016
0.000 | 0.050
0.043 | 0.221
0.000 | 0.142
0.000 | 0.055
0.720 | 0.832
0.000 | 0.000
| Plot | Mito | Lyso | Perox | ER | Golgi | PM | Cytosol | Nucleus | |||||
| Expt A |
4 peptides |
6 spectra |
|
0.000 0.000 | 0.000 |
0.000 0.000 | 0.016 |
0.000 0.000 | 0.050 |
0.179 0.043 | 0.221 |
0.031 0.000 | 0.142 |
0.000 0.000 | 0.055 |
0.790 0.720 | 0.832 |
0.000 0.000 | 0.000 |
| 2 spectra, ERPQTDSAVAR | 0.000 | 0.000 | 0.178 | 0.146 | 0.000 | 0.099 | 0.576 | 0.000 | ||
| 1 spectrum, YTSHQGAAAGPR | 0.000 | 0.000 | 0.000 | 0.382 | 0.121 | 0.000 | 0.497 | 0.000 | ||
| 2 spectra, VLLFPPVSSR | 0.000 | 0.000 | 0.000 | 0.000 | 0.000 | 0.000 | 1.000 | 0.000 | ||
| 1 spectrum, ALQRPK | 0.000 | 0.000 | 0.000 | 0.046 | 0.000 | 0.000 | 0.954 | 0.000 |
| Plot | Mito | Lyso or Perox | ER | Golgi | PM | Cytosol | Nucleus | ||||||
| Expt B |
1 peptide |
2 spectra |
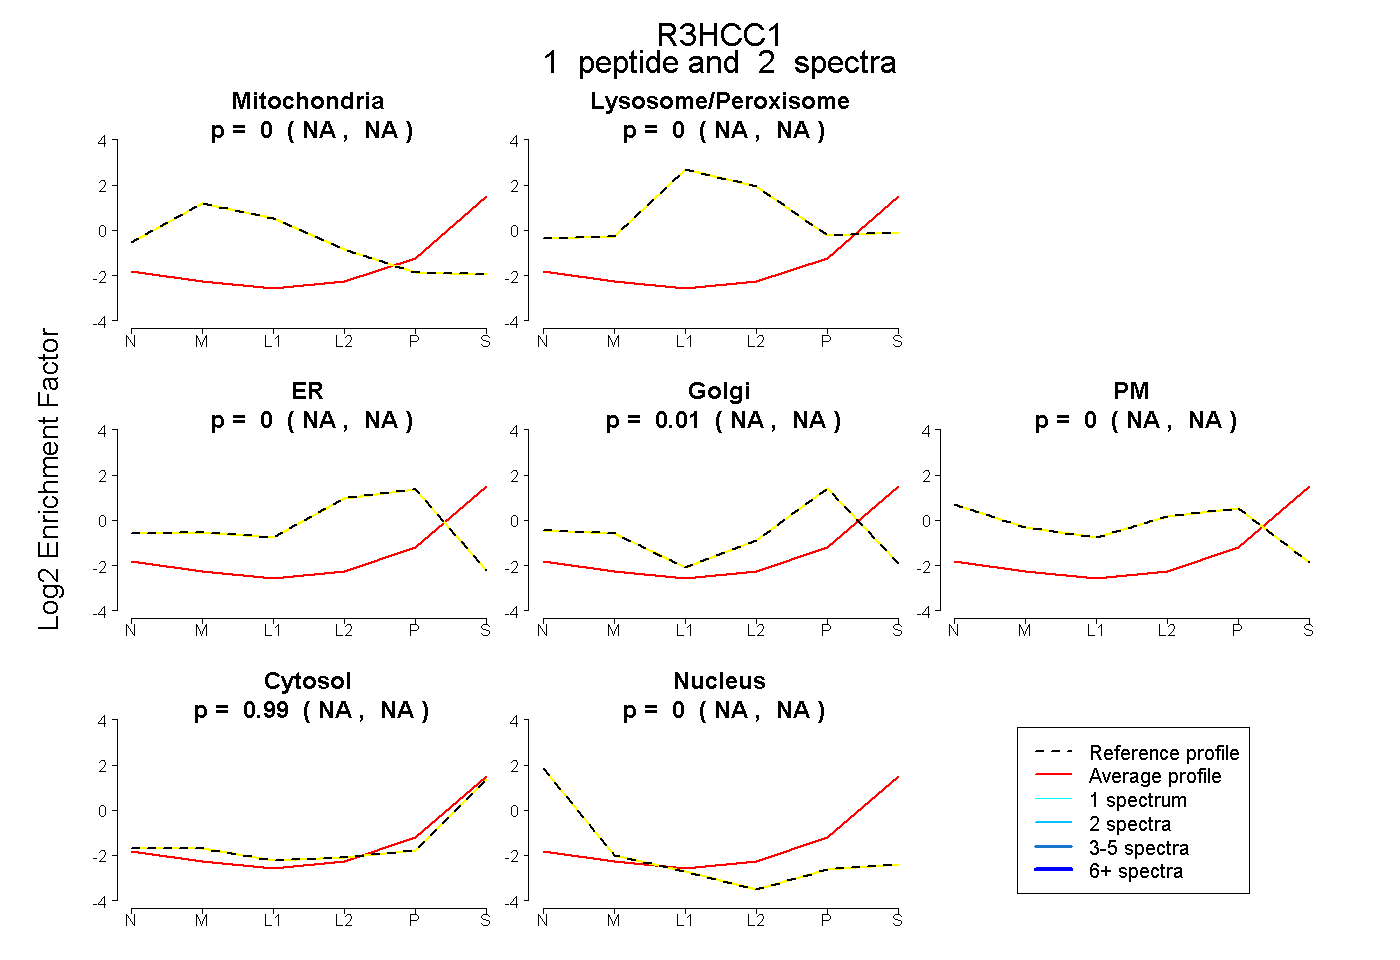 |
0.000 NA | NA |
0.000 NA | NA |
0.000 NA | NA |
0.012 NA | NA |
0.000 NA | NA |
0.988 NA | NA |
0.000 NA | NA |
|||
| Plot | Lyso | Other | |||||||||||
| Expt C |
2 peptides |
2 spectra |
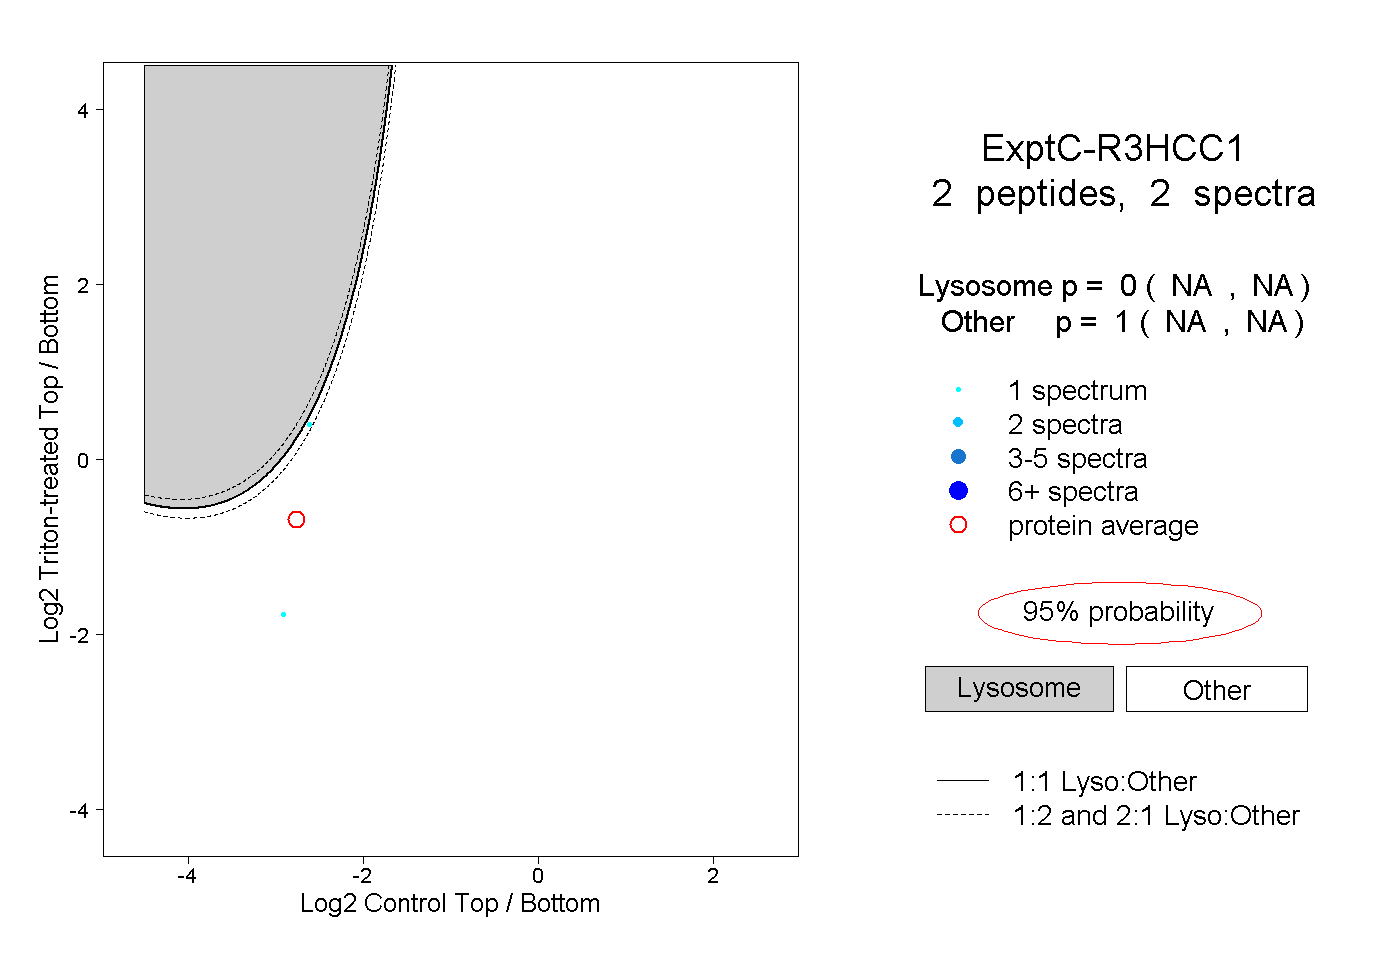 |
0.000 NA | NA |
1.000 NA | NA |