 8
8peptides
spectra

0.000 | 0.000
0.000 | 0.000
0.000 | 0.000
0.000 | 0.078
0.015 | 0.123
0.000 | 0.000
0.290 | 0.323
0.563 | 0.600
3peptides
spectra
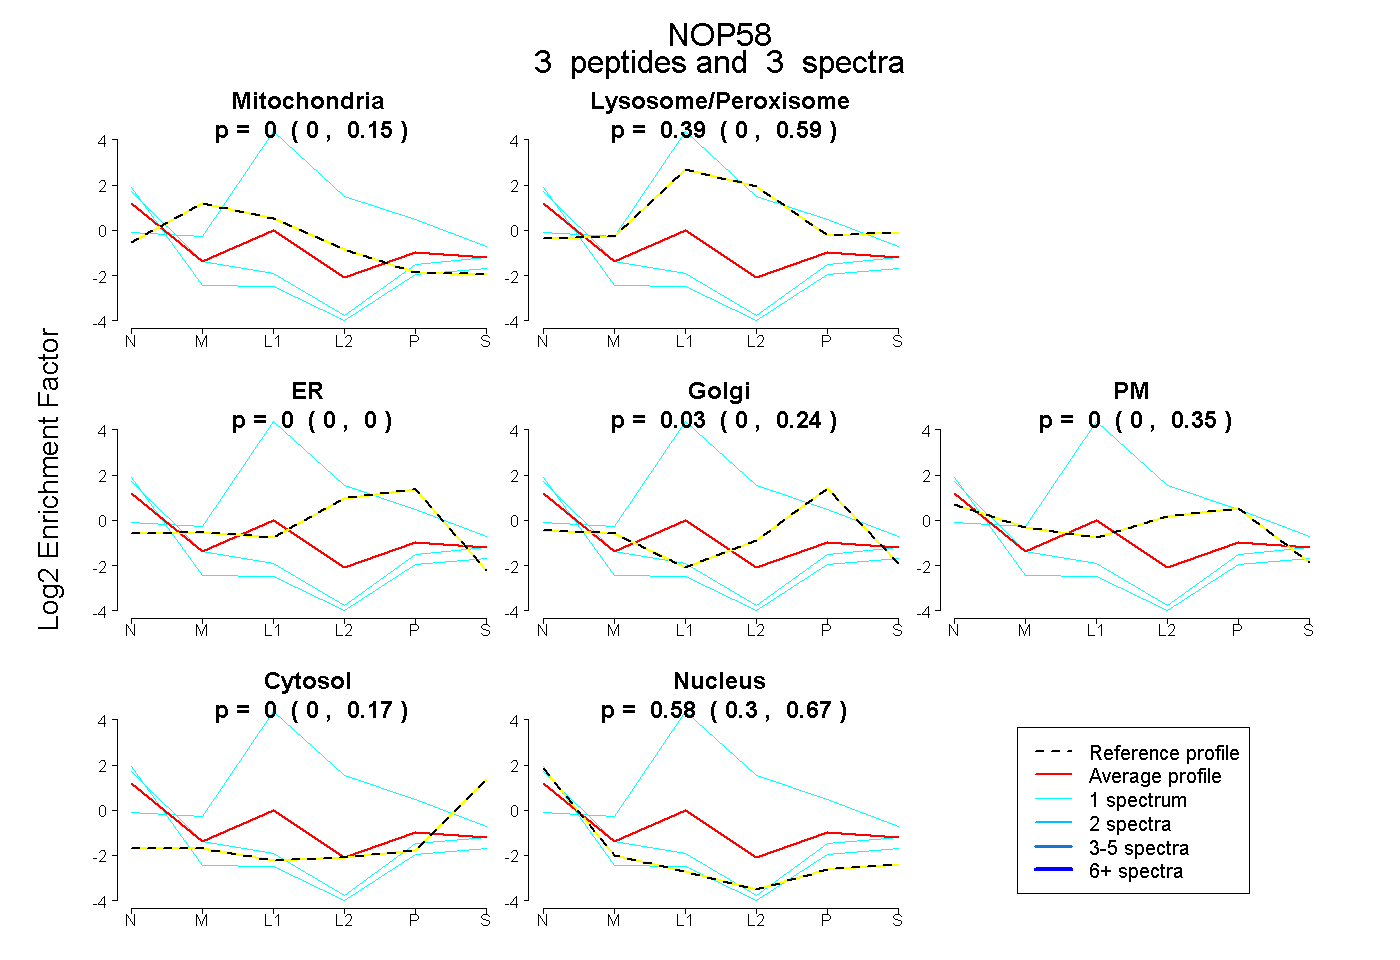
0.000 | 0.148
0.000 | 0.587
0.000 | 0.000
0.000 | 0.240
0.000 | 0.354
0.000 | 0.169
0.298 | 0.670