 8
8peptides
spectra

0.000 | 0.000
0.000 | 0.000
0.000 | 0.000
0.000 | 0.078
0.015 | 0.123
0.000 | 0.000
0.290 | 0.323
0.563 | 0.600
| Plot | Mito | Lyso | Perox | ER | Golgi | PM | Cytosol | Nucleus | |||||
| Expt A |
8 peptides |
21 spectra |
|
0.000 0.000 | 0.000 |
0.000 0.000 | 0.000 |
0.000 0.000 | 0.000 |
0.005 0.000 | 0.078 |
0.104 0.015 | 0.123 |
0.000 0.000 | 0.000 |
0.308 0.290 | 0.323 |
0.583 0.563 | 0.600 |
| 1 spectrum, EMAAMCLGLAHSLSR | 0.000 | 0.000 | 0.042 | 0.000 | 0.000 | 0.308 | 0.499 | 0.150 | ||
| 2 spectra, LQEVDSLWK | 0.000 | 0.000 | 0.000 | 0.000 | 0.000 | 0.000 | 0.082 | 0.918 | ||
| 3 spectra, EAHEPLAVADAK | 0.010 | 0.000 | 0.000 | 0.000 | 0.000 | 0.000 | 0.202 | 0.788 | ||
| 2 spectra, TQLYEYLQNR | 0.000 | 0.000 | 0.000 | 0.000 | 0.000 | 0.000 | 0.122 | 0.878 | ||
| 5 spectra, EFETPEK | 0.000 | 0.000 | 0.000 | 0.057 | 0.000 | 0.000 | 0.379 | 0.565 | ||
| 1 spectrum, TYDPSGDSTLPTCSK | 0.000 | 0.000 | 0.010 | 0.000 | 0.000 | 0.510 | 0.465 | 0.015 | ||
| 6 spectra, YDAFGEDSSSAMGAENR | 0.000 | 0.000 | 0.000 | 0.186 | 0.003 | 0.000 | 0.273 | 0.538 | ||
| 1 spectrum, EWYGWHFPELGK | 0.000 | 0.000 | 0.000 | 0.349 | 0.070 | 0.000 | 0.173 | 0.407 |
| Plot | Mito | Lyso or Perox | ER | Golgi | PM | Cytosol | Nucleus | ||||||
| Expt B |
3 peptides |
3 spectra |
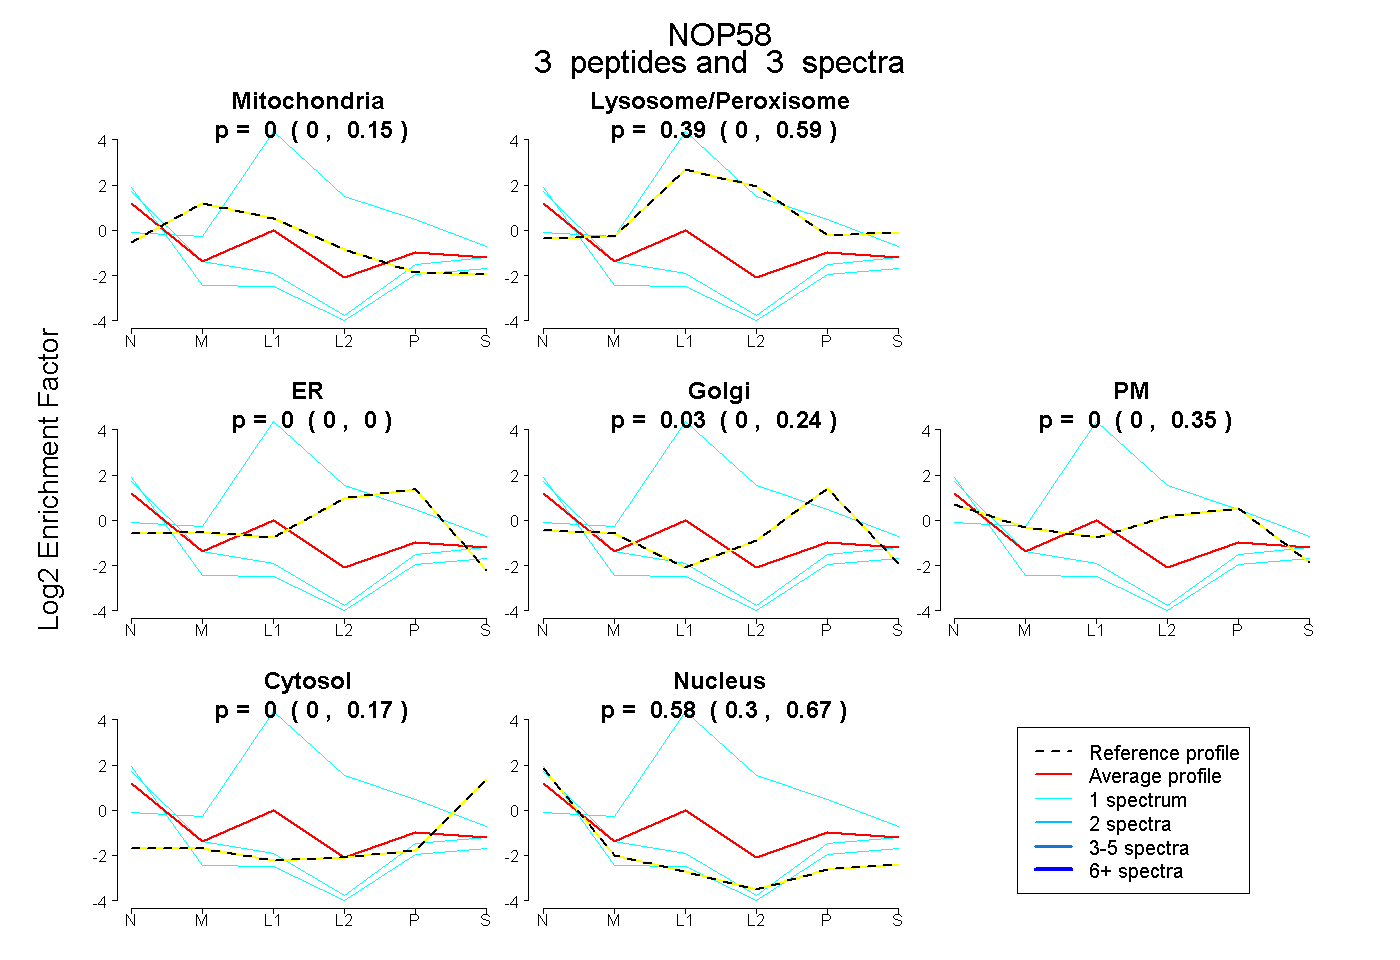 |
0.000 0.000 | 0.148 |
0.391 0.000 | 0.587 |
0.000 0.000 | 0.000 |
0.028 0.000 | 0.240 |
0.000 0.000 | 0.354 |
0.000 0.000 | 0.169 |
0.580 0.298 | 0.670 |