 2
2peptides
spectra

0.000 | 0.000
0.000 | 0.017
0.000 | 0.000
0.000 | 0.000
0.156 | 0.180
0.000 | 0.000
0.813 | 0.837
0.000 | 0.000
1peptide
spectrum
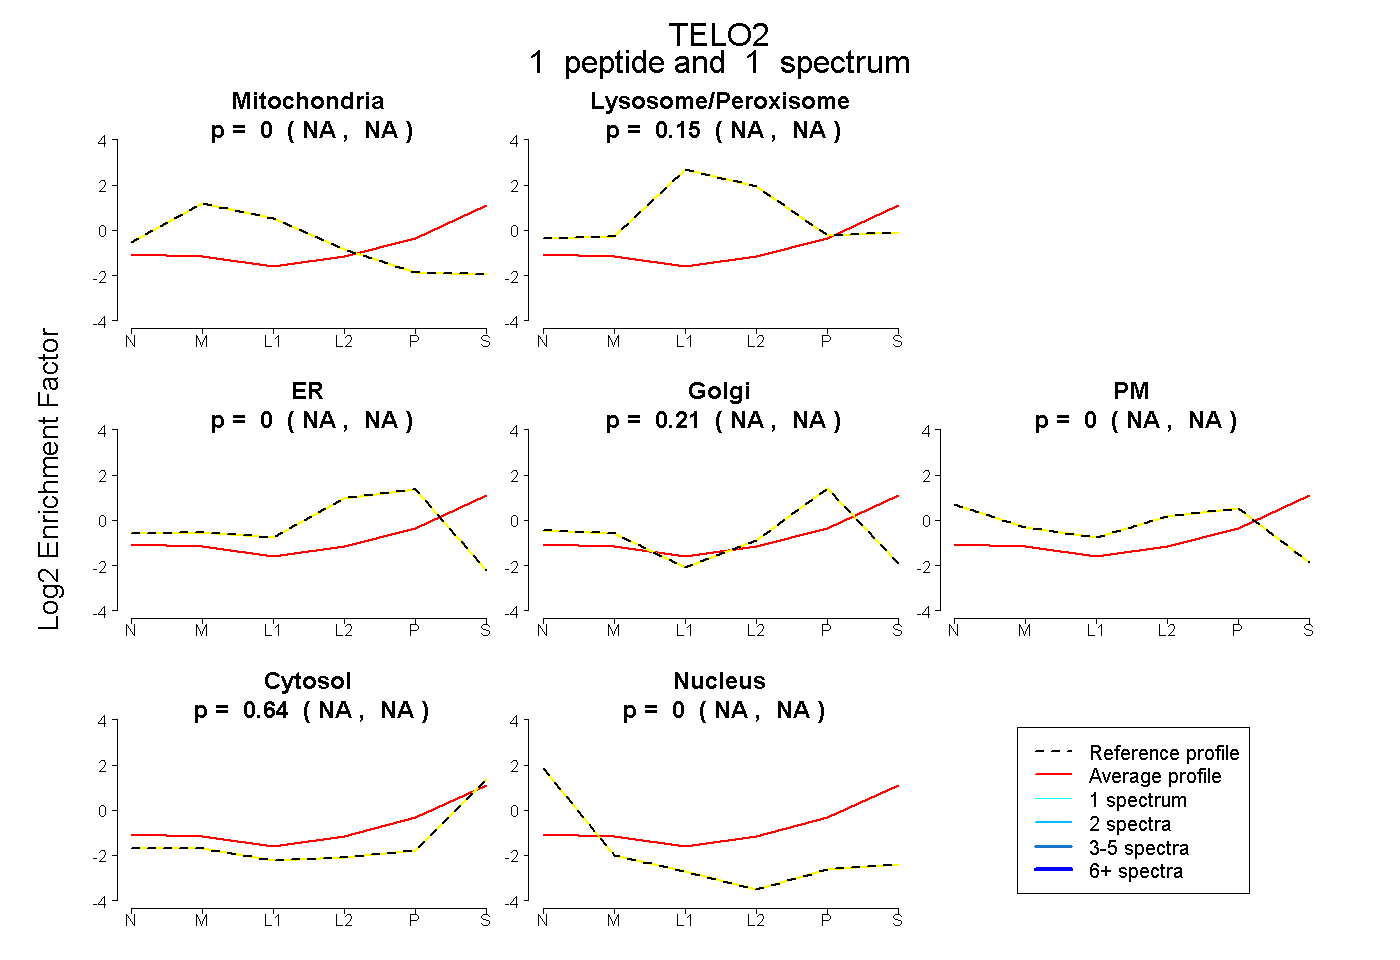
NA | NA
NA | NA
NA | NA
NA | NA
NA | NA
NA | NA
NA | NA
2peptides
spectra
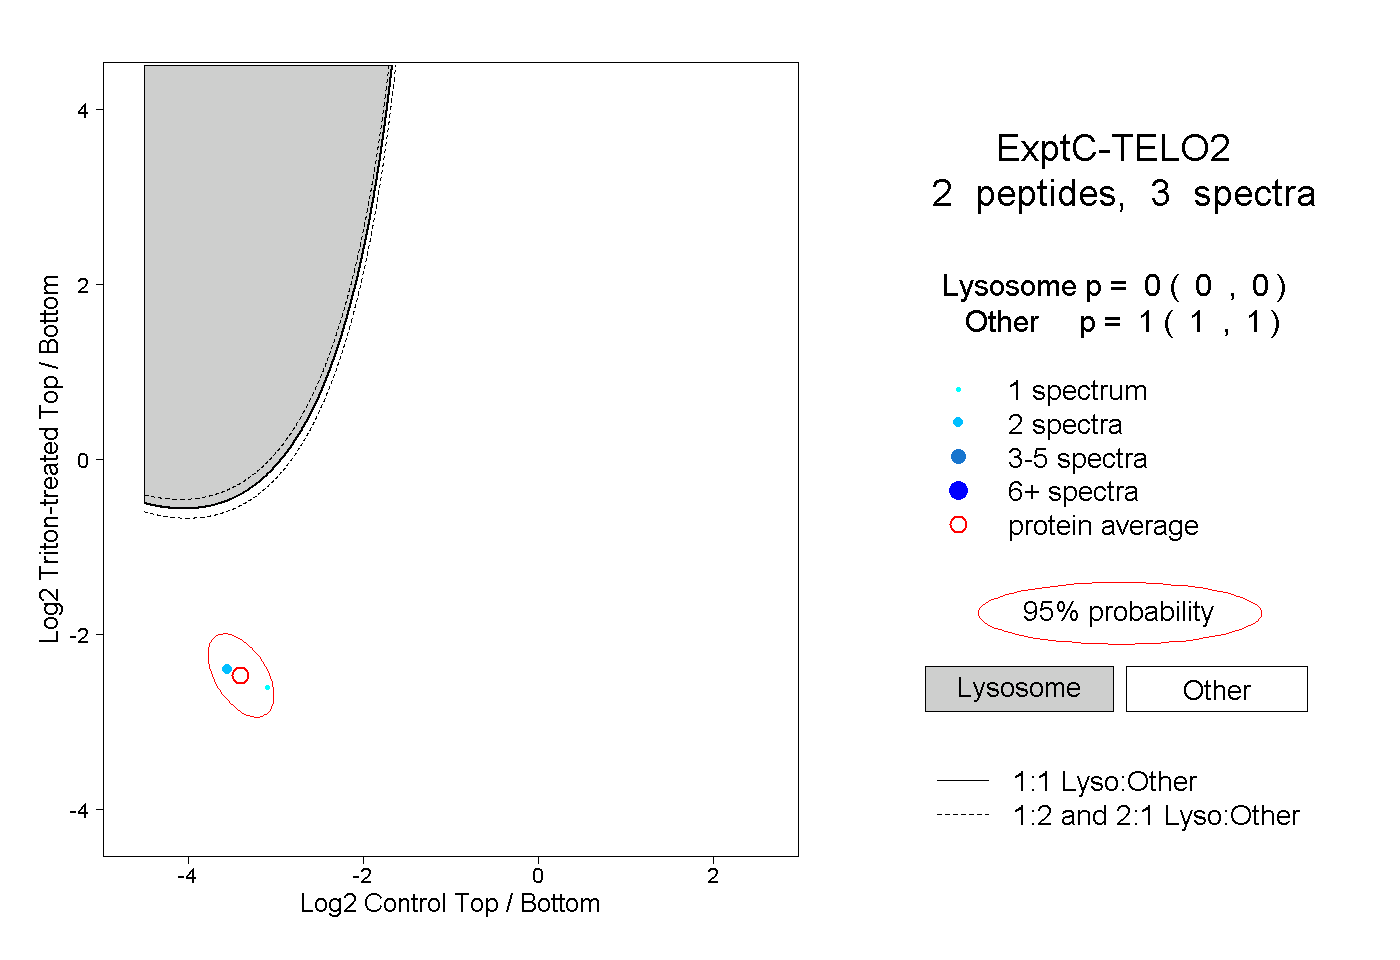
0.000 | 0.000
1.000 | 1.000