 2
2peptides
spectra

0.000 | 0.000
0.000 | 0.017
0.000 | 0.000
0.000 | 0.000
0.156 | 0.180
0.000 | 0.000
0.813 | 0.837
0.000 | 0.000
| Plot | Mito | Lyso | Perox | ER | Golgi | PM | Cytosol | Nucleus | |||||
| Expt A |
2 peptides |
4 spectra |
|
0.000 0.000 | 0.000 |
0.000 0.000 | 0.017 |
0.000 0.000 | 0.000 |
0.000 0.000 | 0.000 |
0.173 0.156 | 0.180 |
0.000 0.000 | 0.000 |
0.827 0.813 | 0.837 |
0.000 0.000 | 0.000 |
| 2 spectra, RPLLIQVLK | 0.000 | 0.003 | 0.000 | 0.000 | 0.142 | 0.027 | 0.829 | 0.000 | ||
| 2 spectra, LLDTFLHAGR | 0.000 | 0.000 | 0.000 | 0.000 | 0.174 | 0.000 | 0.826 | 0.000 |
| Plot | Mito | Lyso or Perox | ER | Golgi | PM | Cytosol | Nucleus | ||||||
| Expt B |
1 peptide |
1 spectrum |
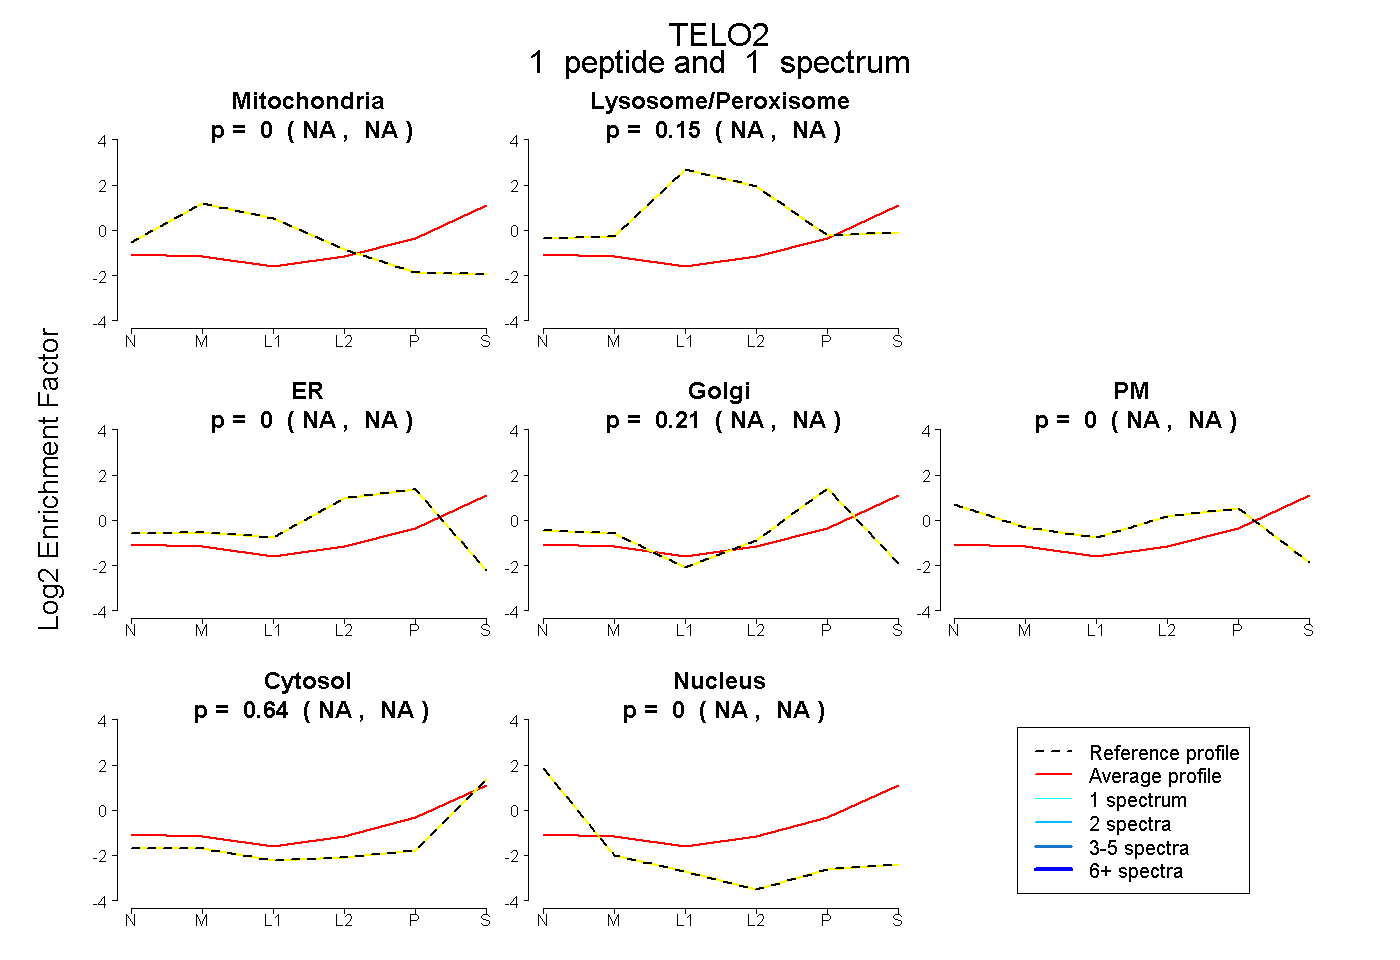 |
0.000 NA | NA |
0.146 NA | NA |
0.000 NA | NA |
0.209 NA | NA |
0.000 NA | NA |
0.645 NA | NA |
0.000 NA | NA |
|||
| Plot | Lyso | Other | |||||||||||
| Expt C |
2 peptides |
3 spectra |
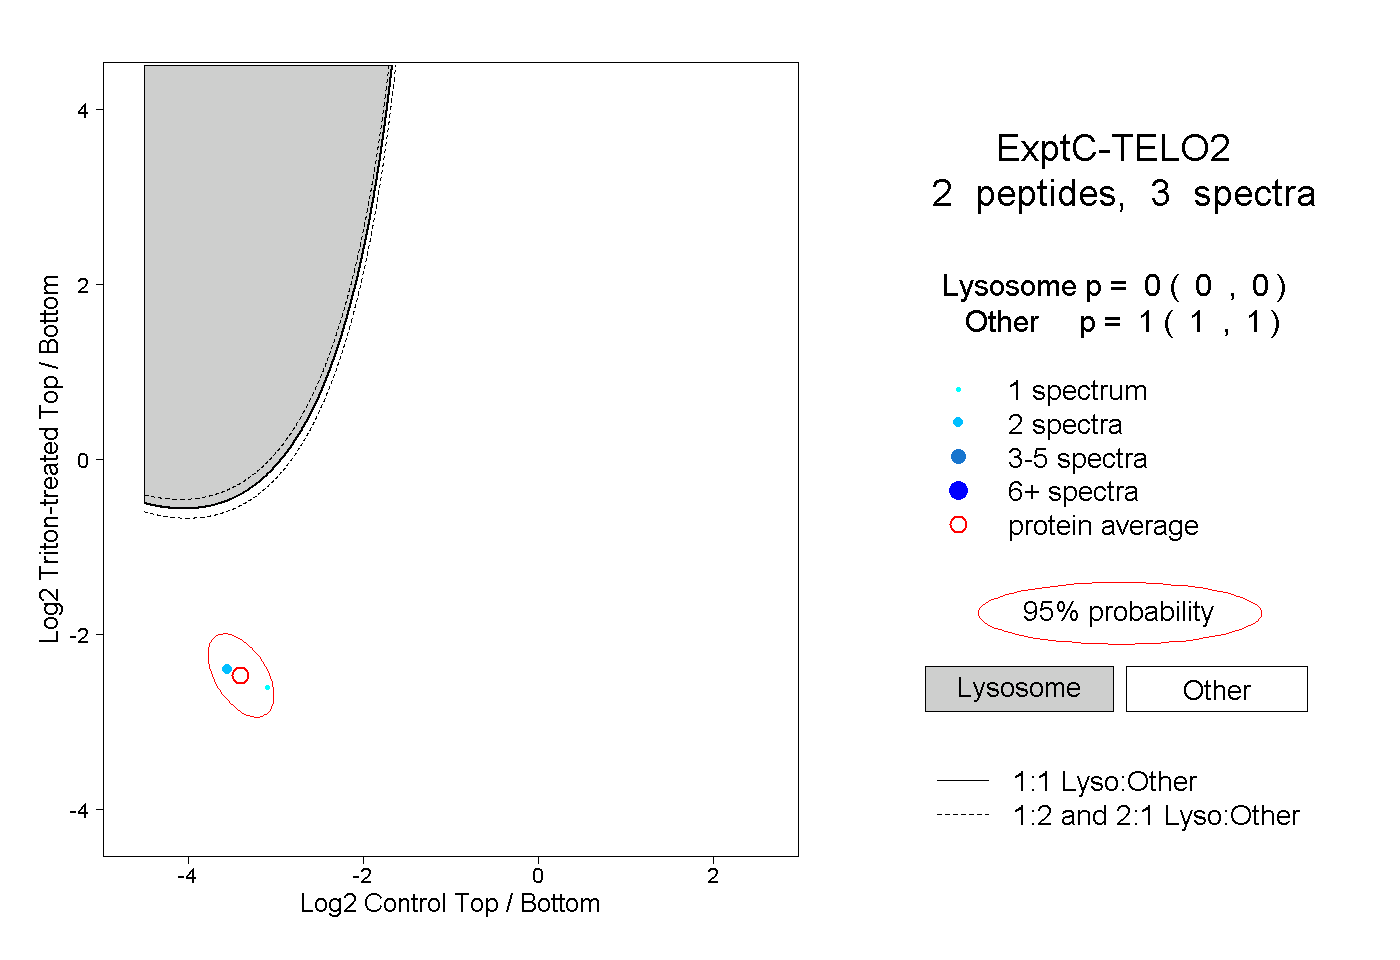 |
0.000 0.000 | 0.000 |
1.000 1.000 | 1.000 |