 3
3peptides
spectra
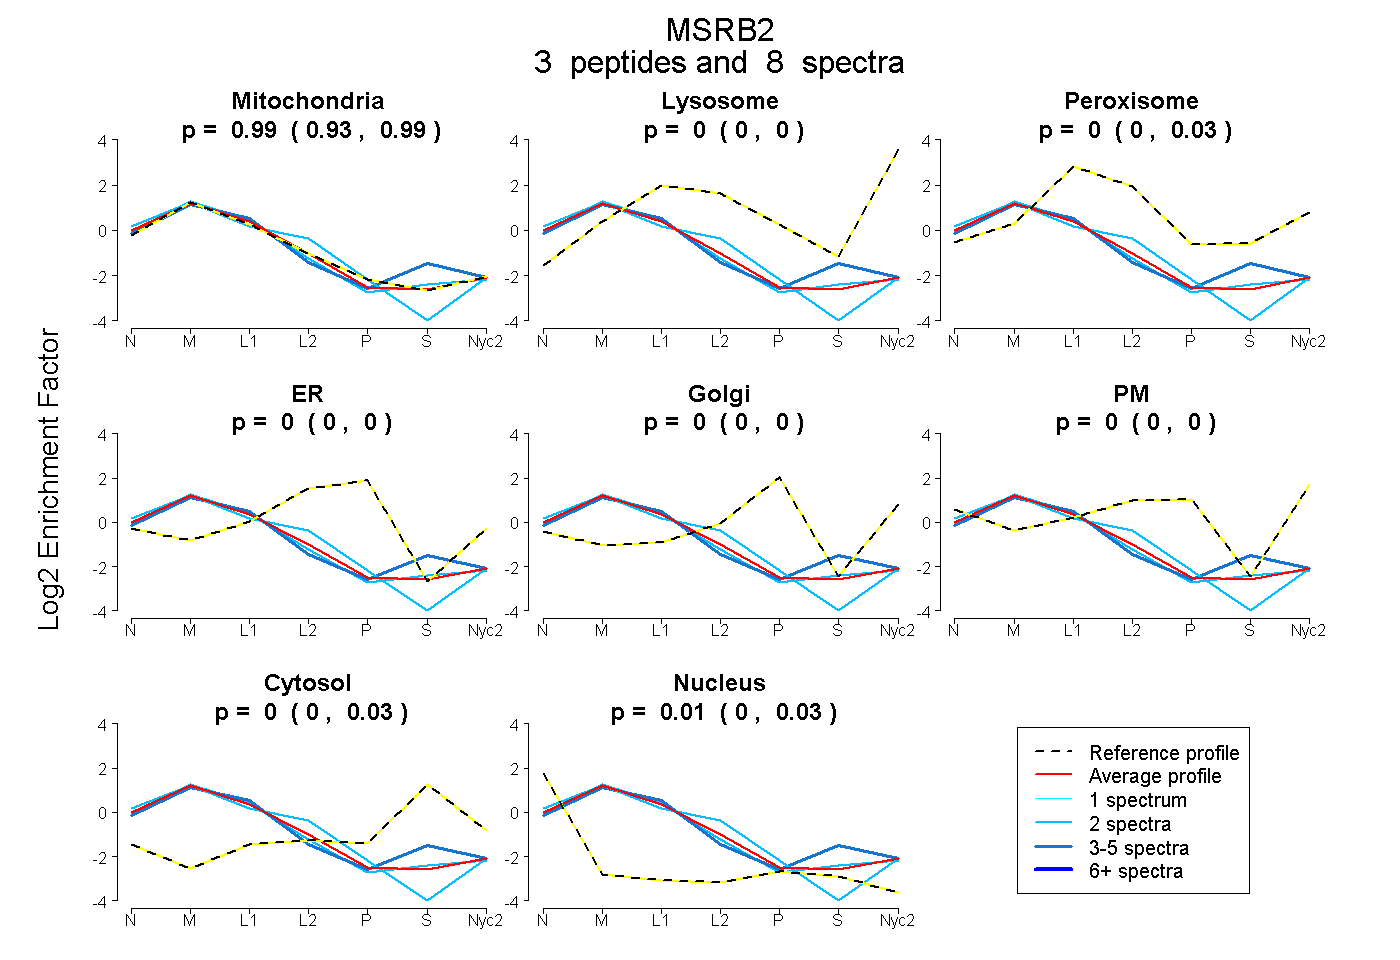
0.927 | 0.992
0.000 | 0.000
0.000 | 0.035
0.000 | 0.000
0.000 | 0.000
0.000 | 0.000
0.000 | 0.033
0.000 | 0.029
6peptides
spectra
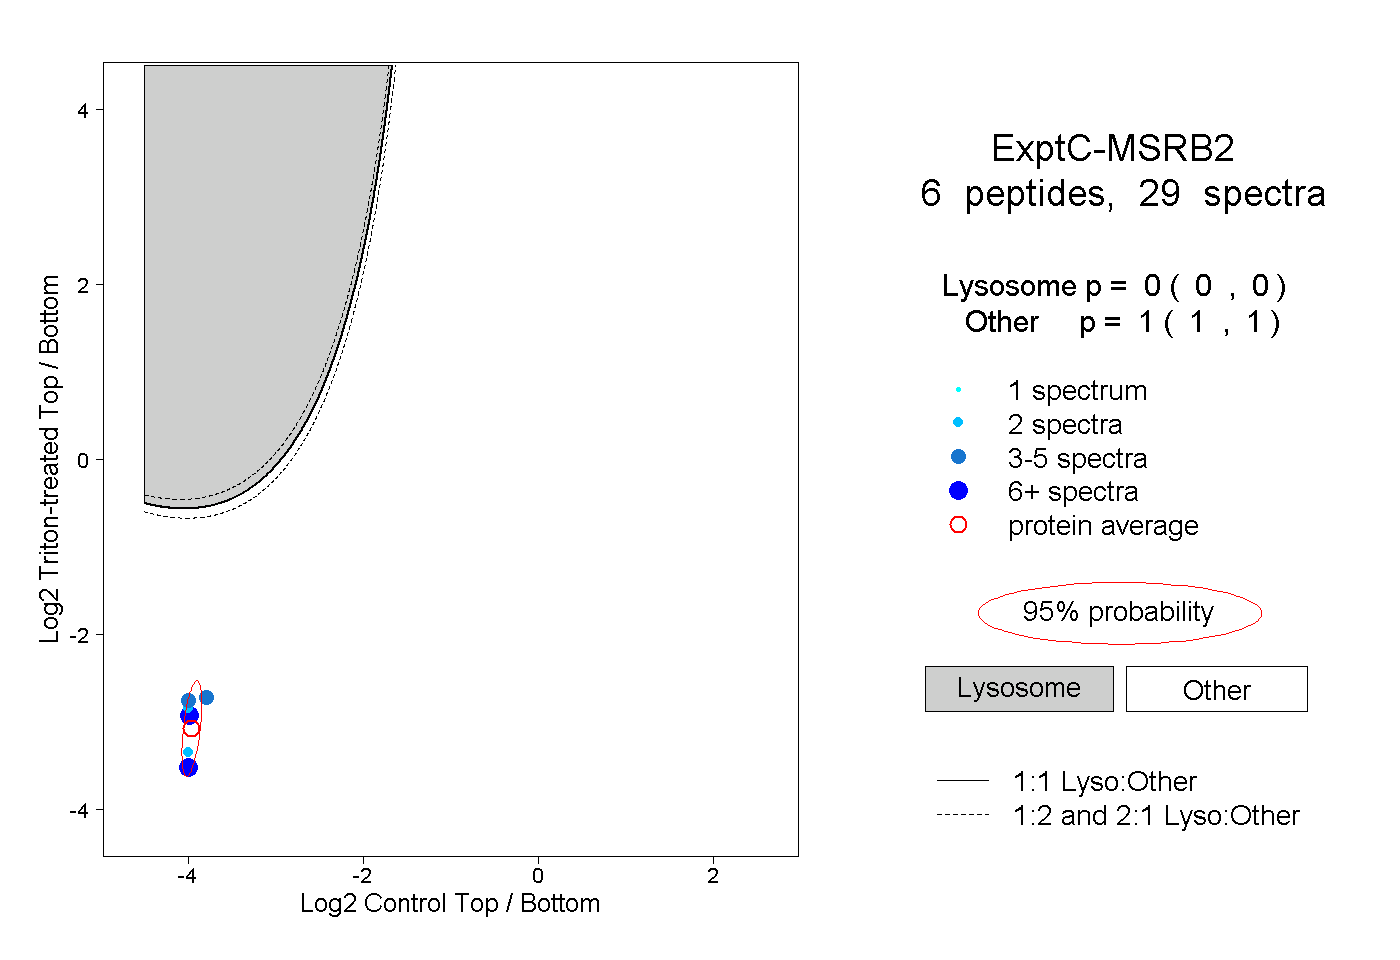
0.000 | 0.000
1.000 | 1.000
3peptides
spectra
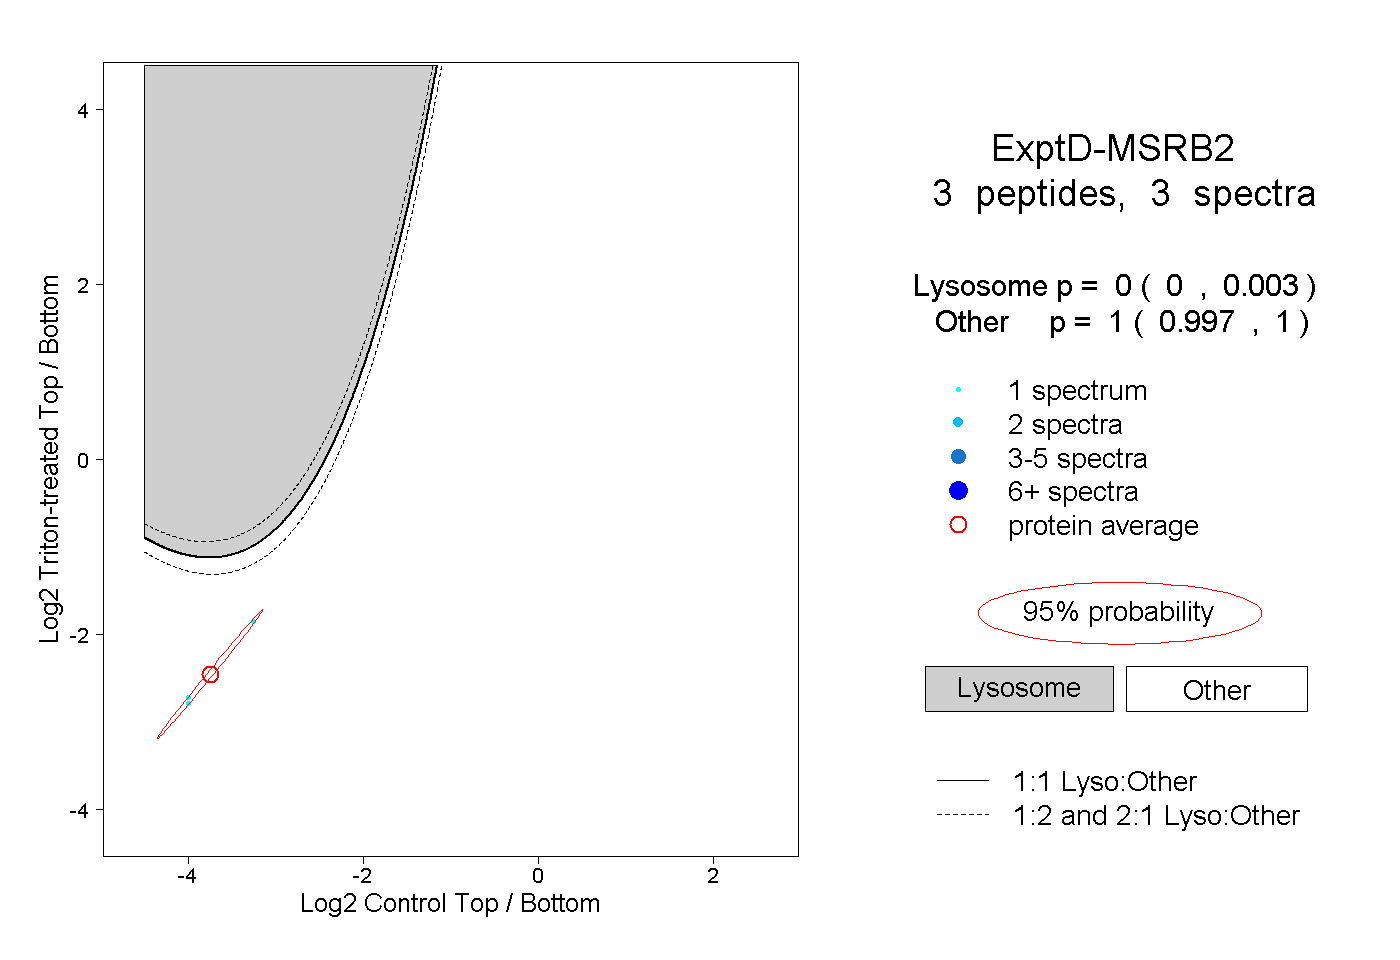
0.000 | 0.003
0.997 | 1.000