 3
3peptides
spectra
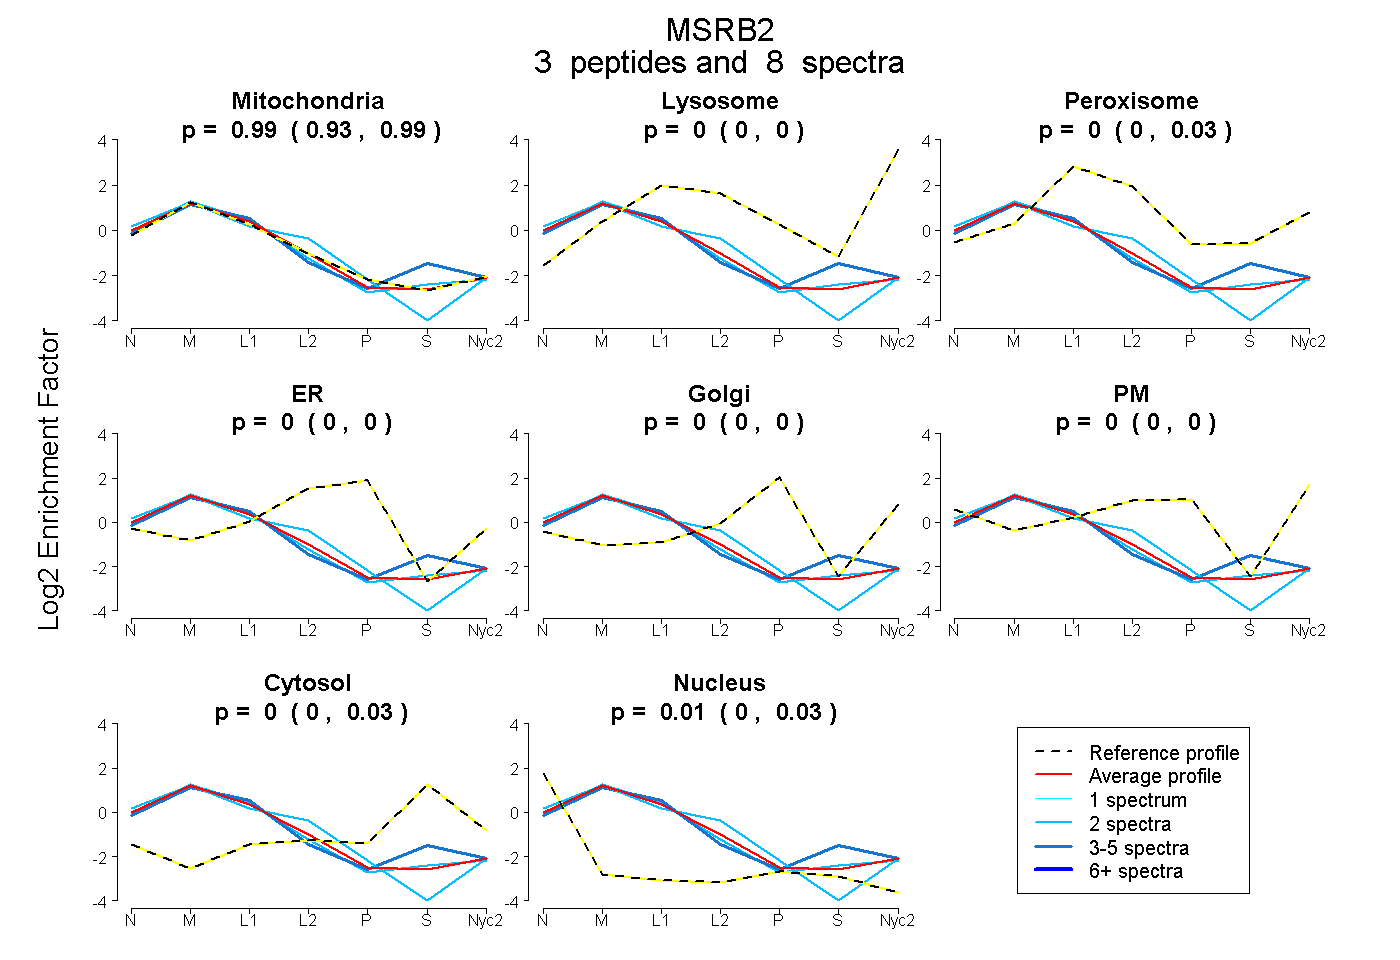
0.927 | 0.992
0.000 | 0.000
0.000 | 0.035
0.000 | 0.000
0.000 | 0.000
0.000 | 0.000
0.000 | 0.033
0.000 | 0.029
| Plot | Mito | Lyso | Perox | ER | Golgi | PM | Cytosol | Nucleus | |||||
| Expt A |
3 peptides |
8 spectra |
|
0.987 0.927 | 0.992 |
0.000 0.000 | 0.000 |
0.000 0.000 | 0.035 |
0.000 0.000 | 0.000 |
0.000 0.000 | 0.000 |
0.000 0.000 | 0.000 |
0.000 0.000 | 0.033 |
0.013 0.000 | 0.029 |
| 4 spectra, LTPEQFYVTR | 0.883 | 0.000 | 0.000 | 0.000 | 0.000 | 0.000 | 0.117 | 0.000 | ||
| 2 spectra, QCEAHLGHVFPDGPDPTGQR | 0.934 | 0.000 | 0.000 | 0.059 | 0.000 | 0.000 | 0.000 | 0.007 | ||
| 2 spectra, FCINSVALK | 0.982 | 0.000 | 0.000 | 0.000 | 0.000 | 0.000 | 0.000 | 0.018 |
| Plot | Lyso | Other | |||||||||||
| Expt C |
6 peptides |
29 spectra |
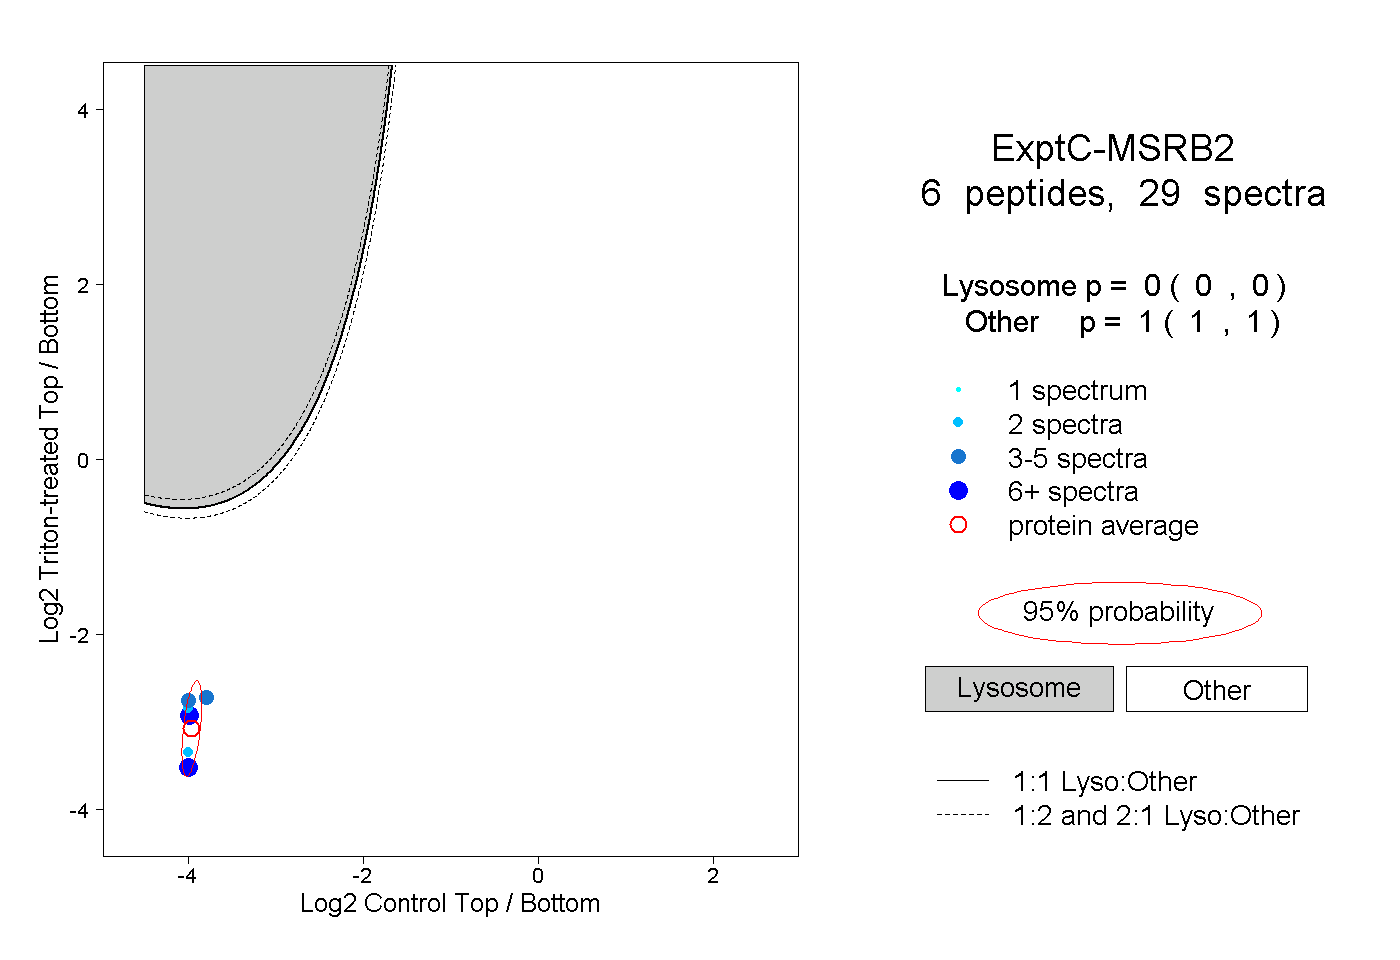 |
0.000 0.000 | 0.000 |
1.000 1.000 | 1.000 |
||||||||
| Plot | Lyso | Other | |||||||||||
| Expt D |
3 peptides |
3 spectra |
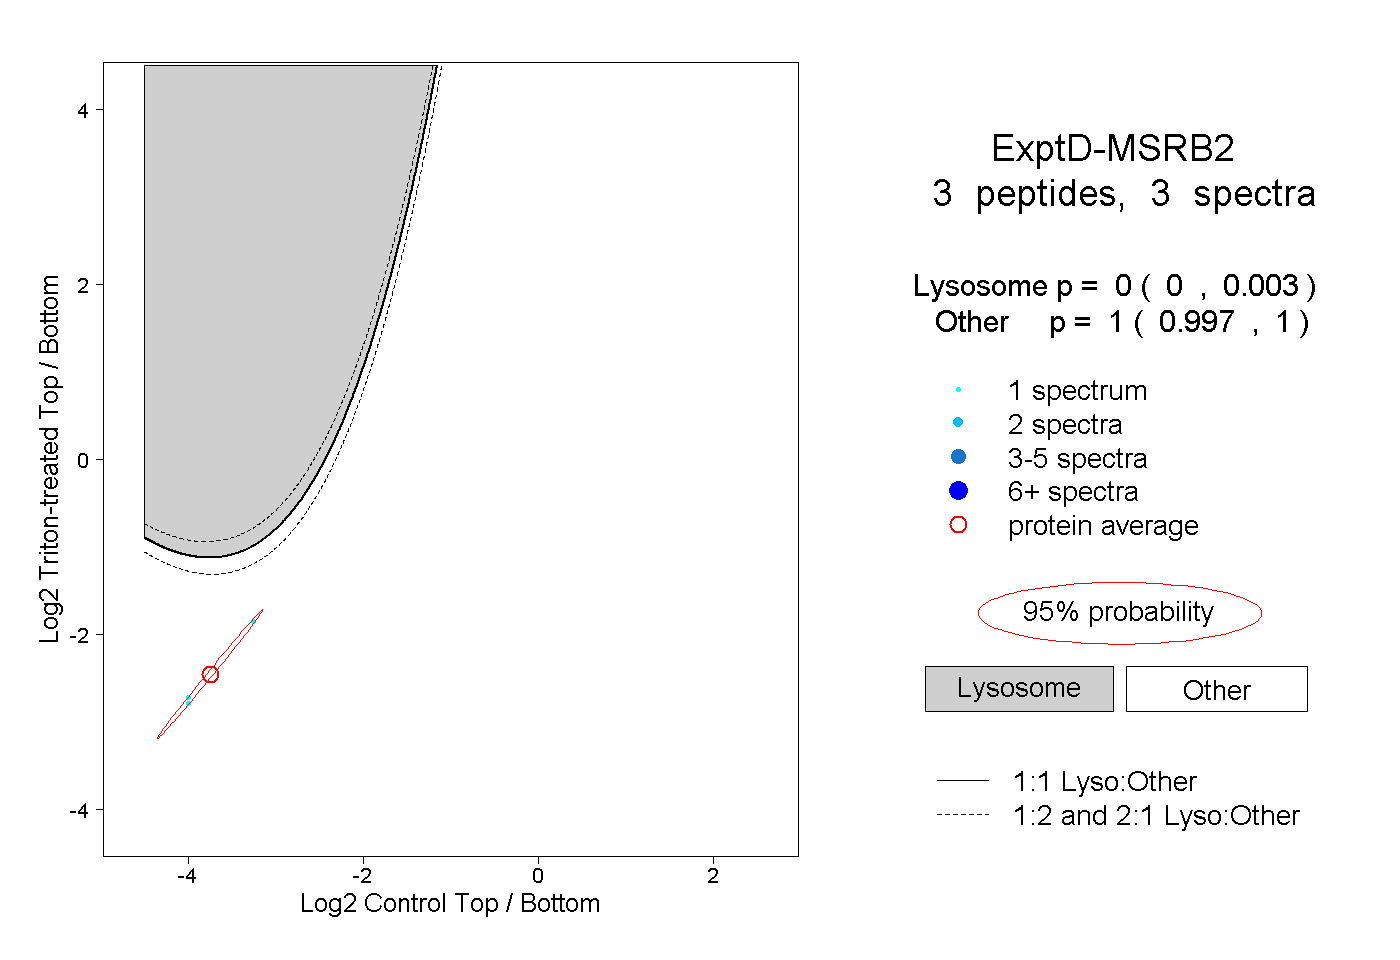 |
0.000 0.000 | 0.003 |
1.000 0.997 | 1.000 |