 16
16peptides
spectra
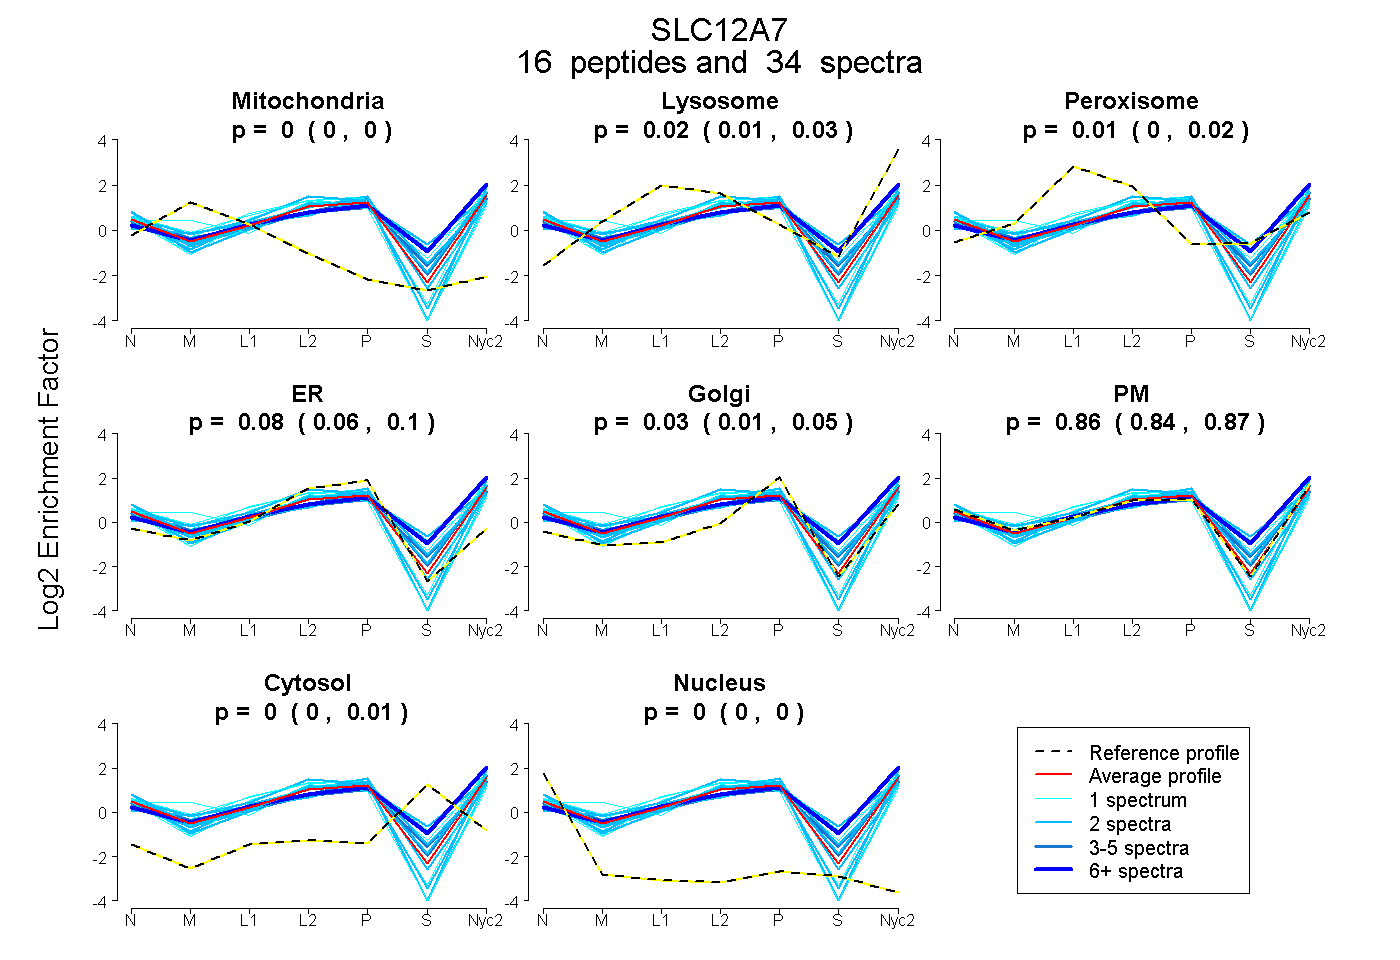
0.000 | 0.000
0.008 | 0.028
0.000 | 0.021
0.061 | 0.096
0.013 | 0.051
0.837 | 0.873
0.000 | 0.013
0.000 | 0.000
3peptides
spectra
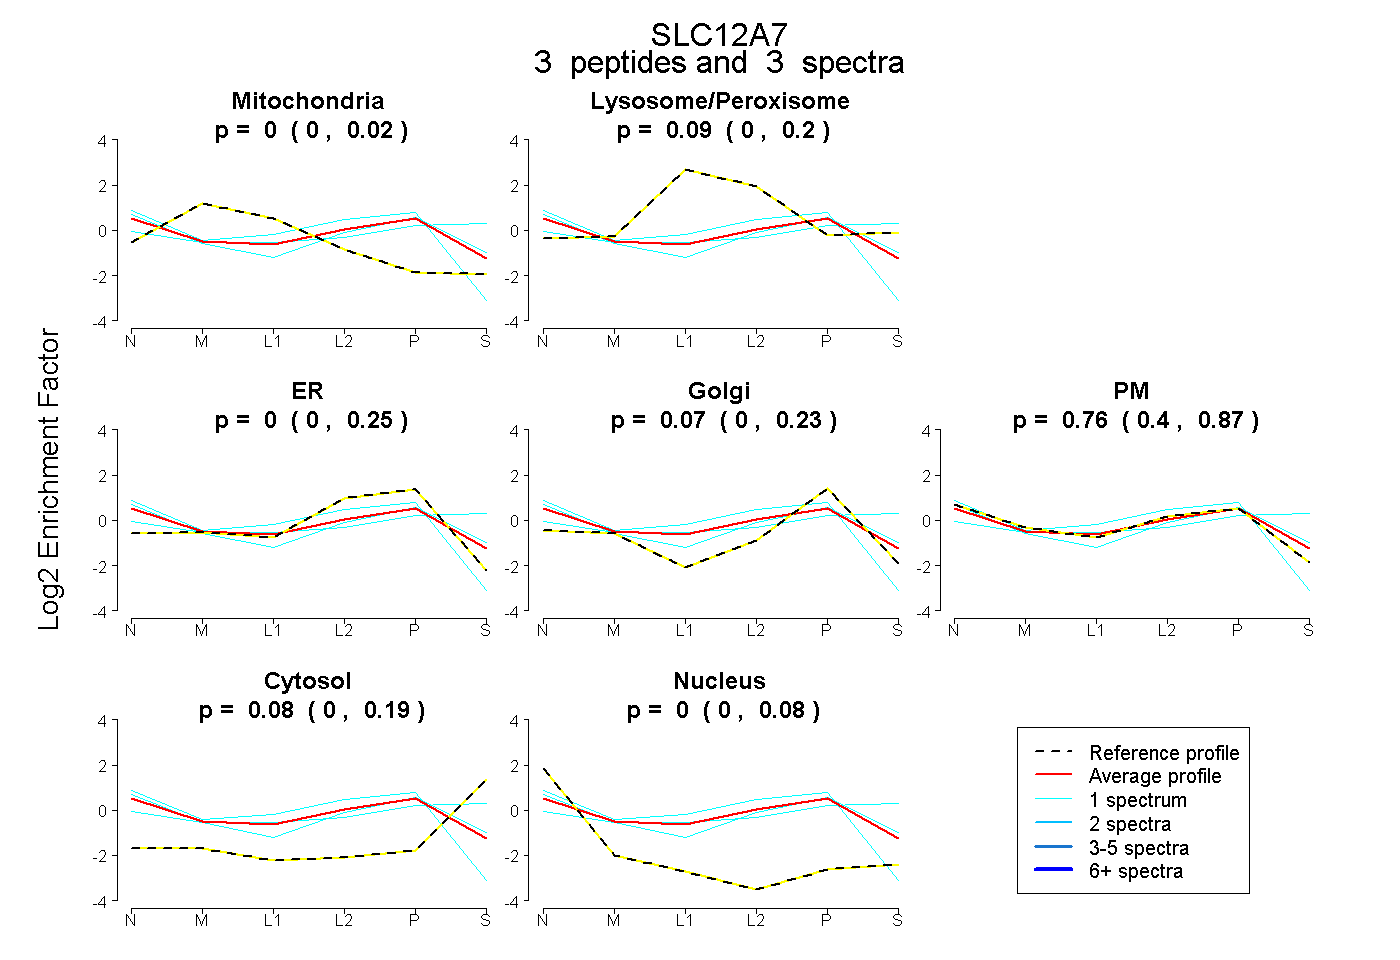
0.000 | 0.023
0.000 | 0.204
0.000 | 0.247
0.000 | 0.233
0.399 | 0.865
0.000 | 0.187
0.000 | 0.082
23peptides
spectra
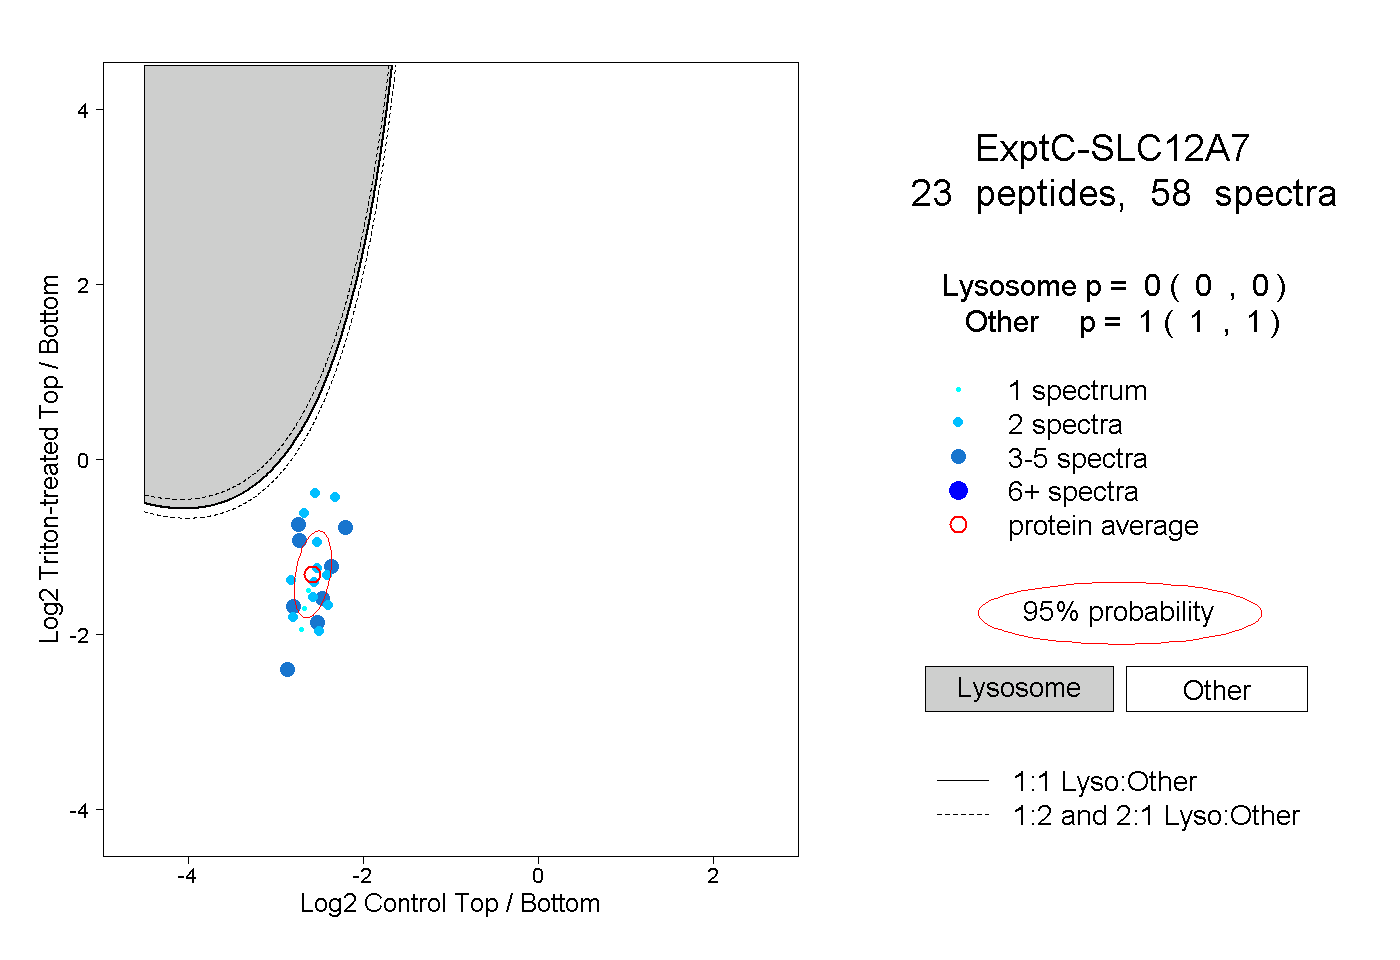
0.000 | 0.000
1.000 | 1.000
5peptides
spectra
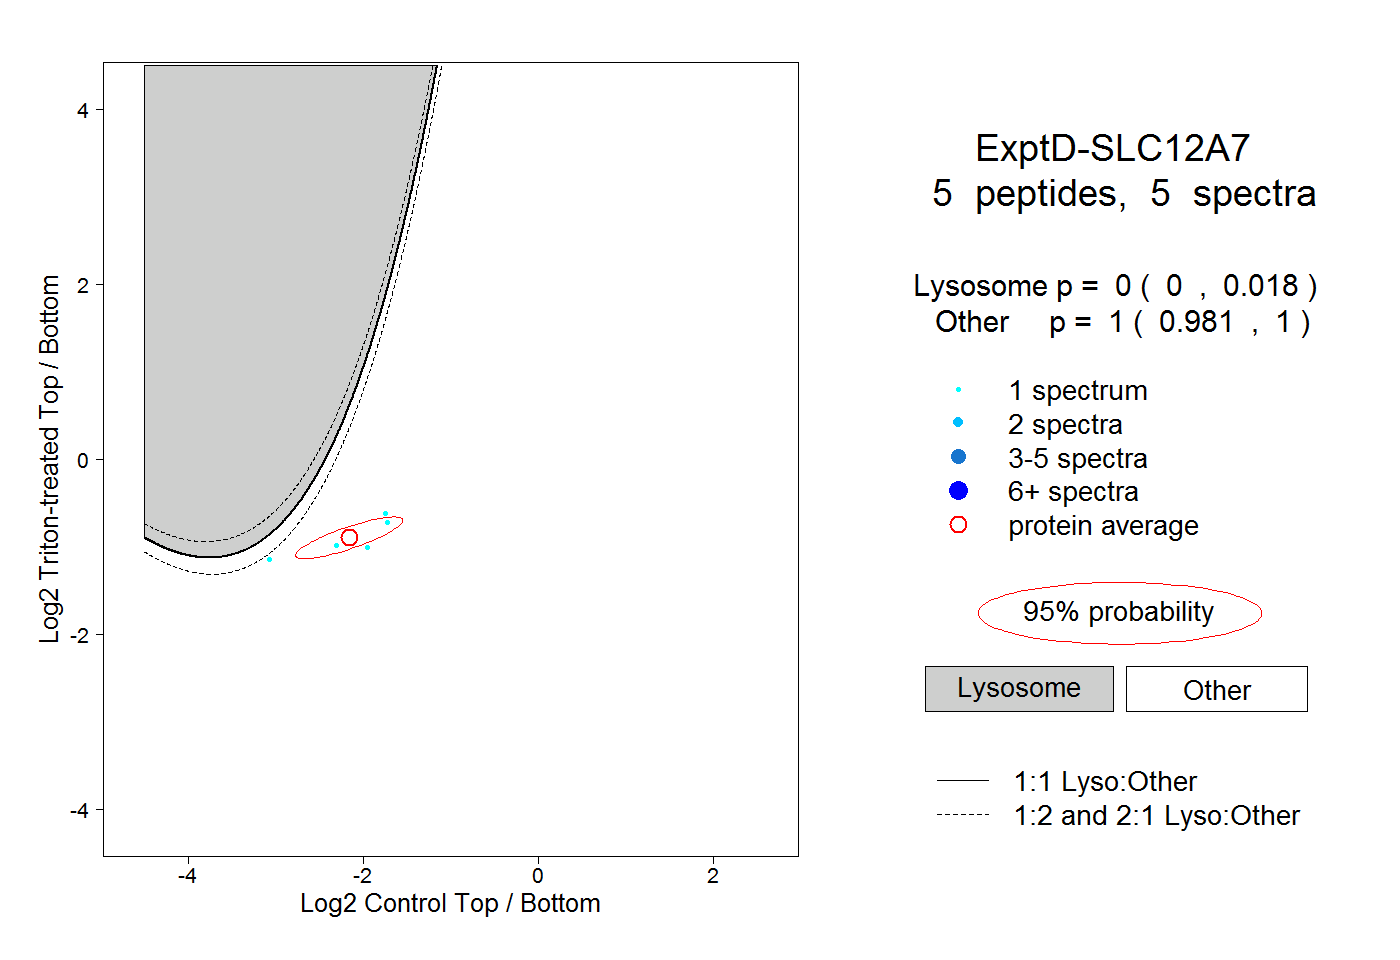
0.000 | 0.018
0.981 | 1.000