 16
16peptides
spectra
0.000 | 0.000
0.008 | 0.028
0.000 | 0.021
0.061 | 0.096
0.013 | 0.051
0.837 | 0.873
0.000 | 0.013
0.000 | 0.000
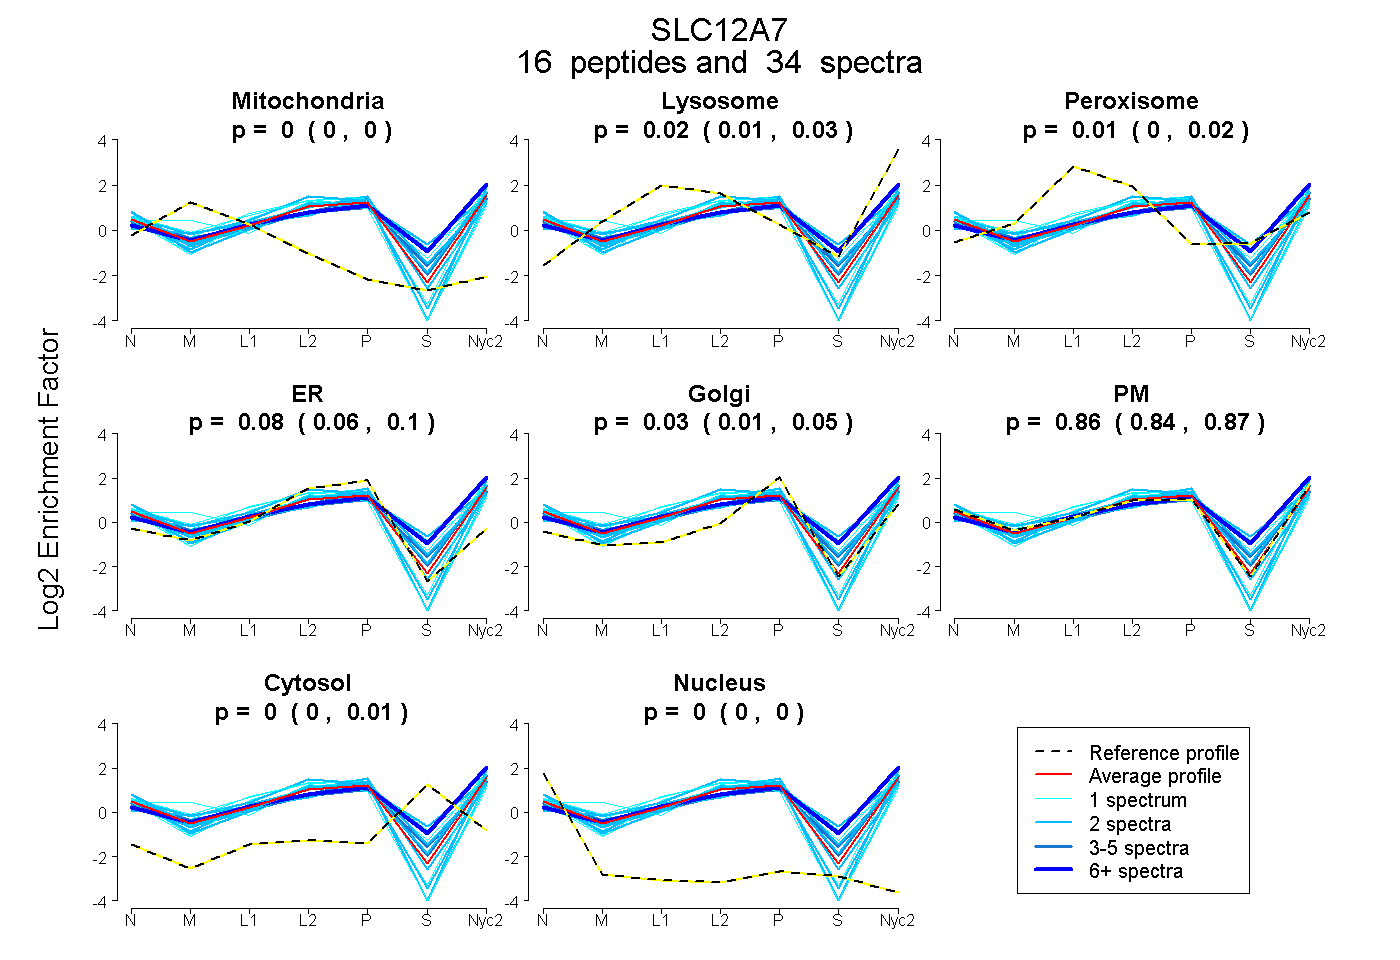
| Plot | Mito | Lyso | Perox | ER | Golgi | PM | Cytosol | Nucleus | |||||
| Expt A |
16 peptides |
34 spectra |
|
0.000 0.000 | 0.000 |
0.019 0.008 | 0.028 |
0.007 0.000 | 0.021 |
0.081 0.061 | 0.096 |
0.032 0.013 | 0.051 |
0.856 0.837 | 0.873 |
0.005 0.000 | 0.013 |
0.000 0.000 | 0.000 |
| 1 spectrum, QADNPFSWK | 0.082 | 0.000 | 0.000 | 0.132 | 0.000 | 0.786 | 0.000 | 0.000 | ||
| 2 spectra, TLMMEQR | 0.000 | 0.064 | 0.184 | 0.000 | 0.380 | 0.353 | 0.019 | 0.000 | ||
| 2 spectra, AEENIR | 0.000 | 0.135 | 0.029 | 0.000 | 0.026 | 0.611 | 0.200 | 0.000 | ||
| 1 spectrum, NFVDTVR | 0.000 | 0.054 | 0.069 | 0.000 | 0.000 | 0.781 | 0.097 | 0.000 | ||
| 2 spectra, EAQLIHDR | 0.000 | 0.000 | 0.000 | 0.264 | 0.041 | 0.695 | 0.000 | 0.000 | ||
| 2 spectra, MHTAVK | 0.000 | 0.000 | 0.000 | 0.000 | 0.000 | 0.939 | 0.061 | 0.000 | ||
| 2 spectra, NTASHTVATAR | 0.000 | 0.000 | 0.000 | 0.231 | 0.000 | 0.752 | 0.000 | 0.016 | ||
| 1 spectrum, NIDLFPQNQER | 0.000 | 0.052 | 0.000 | 0.000 | 0.000 | 0.948 | 0.000 | 0.000 | ||
| 1 spectrum, DGASHLIQSAGLGGMK | 0.000 | 0.000 | 0.000 | 0.346 | 0.000 | 0.654 | 0.000 | 0.000 | ||
| 2 spectra, VEHGPPHTK | 0.000 | 0.000 | 0.000 | 0.114 | 0.000 | 0.878 | 0.000 | 0.008 | ||
| 6 spectra, TPNWRPR | 0.000 | 0.223 | 0.000 | 0.000 | 0.020 | 0.623 | 0.134 | 0.000 | ||
| 4 spectra, EWGDGIR | 0.000 | 0.071 | 0.005 | 0.000 | 0.181 | 0.728 | 0.015 | 0.000 | ||
| 1 spectrum, ENSPFINNVEVER | 0.000 | 0.077 | 0.000 | 0.061 | 0.000 | 0.855 | 0.007 | 0.000 | ||
| 1 spectrum, GLTIVGSVLEGTYLDK | 0.000 | 0.000 | 0.100 | 0.025 | 0.080 | 0.613 | 0.181 | 0.000 | ||
| 4 spectra, DLQMFLYHLR | 0.000 | 0.043 | 0.072 | 0.000 | 0.105 | 0.683 | 0.097 | 0.000 | ||
| 2 spectra, LLSFTSQLK | 0.000 | 0.000 | 0.000 | 0.045 | 0.000 | 0.955 | 0.000 | 0.000 |
| Plot | Mito | Lyso or Perox | ER | Golgi | PM | Cytosol | Nucleus | ||||||
| Expt B |
3 peptides |
3 spectra |
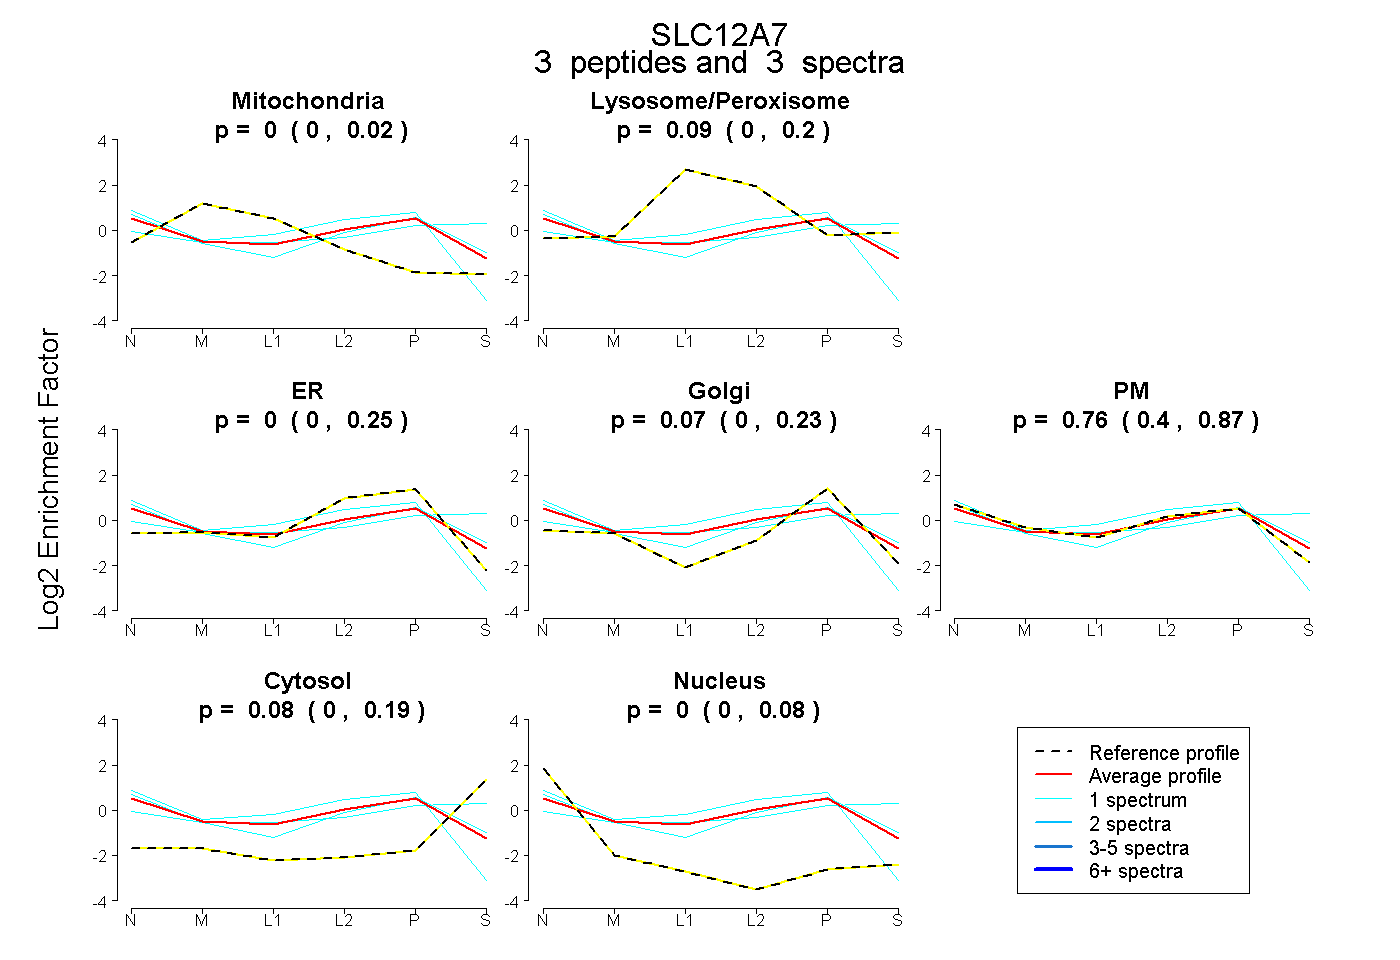 |
0.000 0.000 | 0.023 |
0.094 0.000 | 0.204 |
0.000 0.000 | 0.247 |
0.069 0.000 | 0.233 |
0.757 0.399 | 0.865 |
0.079 0.000 | 0.187 |
0.000 0.000 | 0.082 |
|||
| Plot | Lyso | Other | |||||||||||
| Expt C |
23 peptides |
58 spectra |
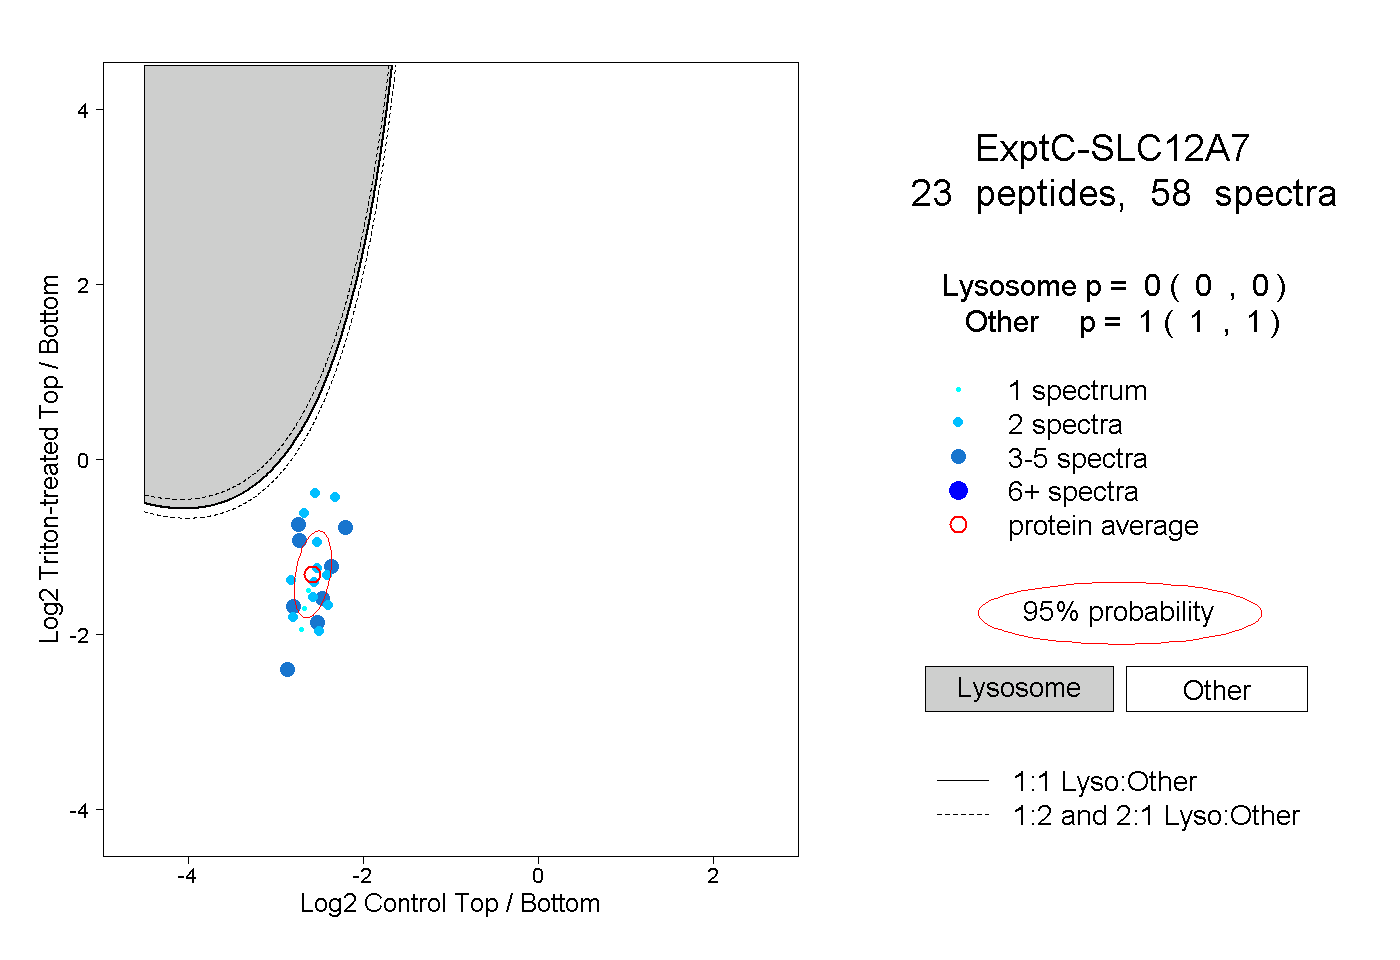 |
0.000 0.000 | 0.000 |
1.000 1.000 | 1.000 |
||||||||
| Plot | Lyso | Other | |||||||||||
| Expt D |
5 peptides |
5 spectra |
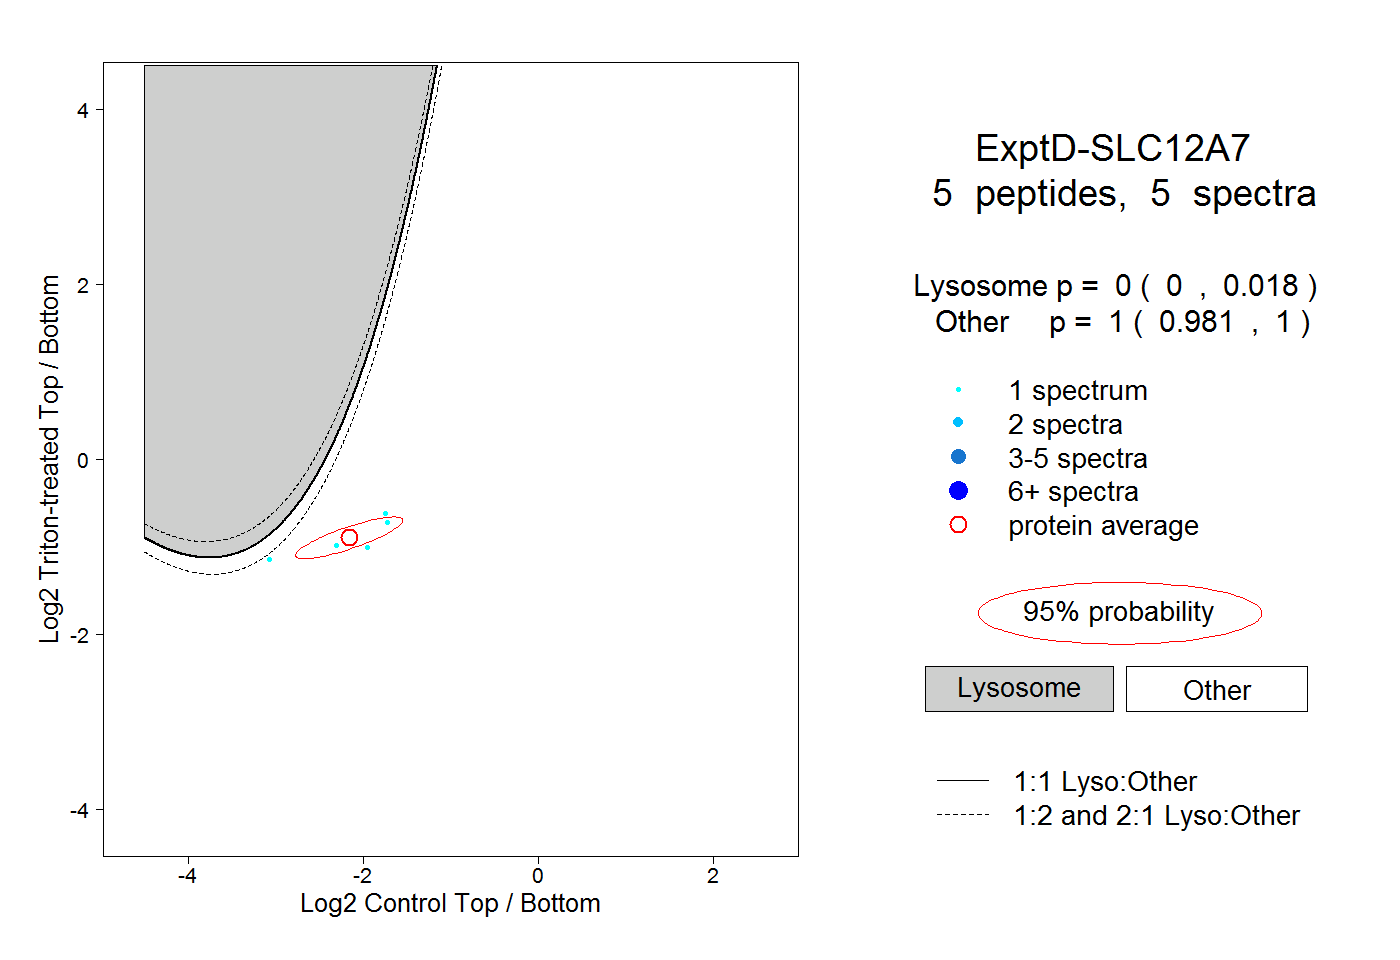 |
0.000 0.000 | 0.018 |
1.000 0.981 | 1.000 |