 6
6peptides
spectra
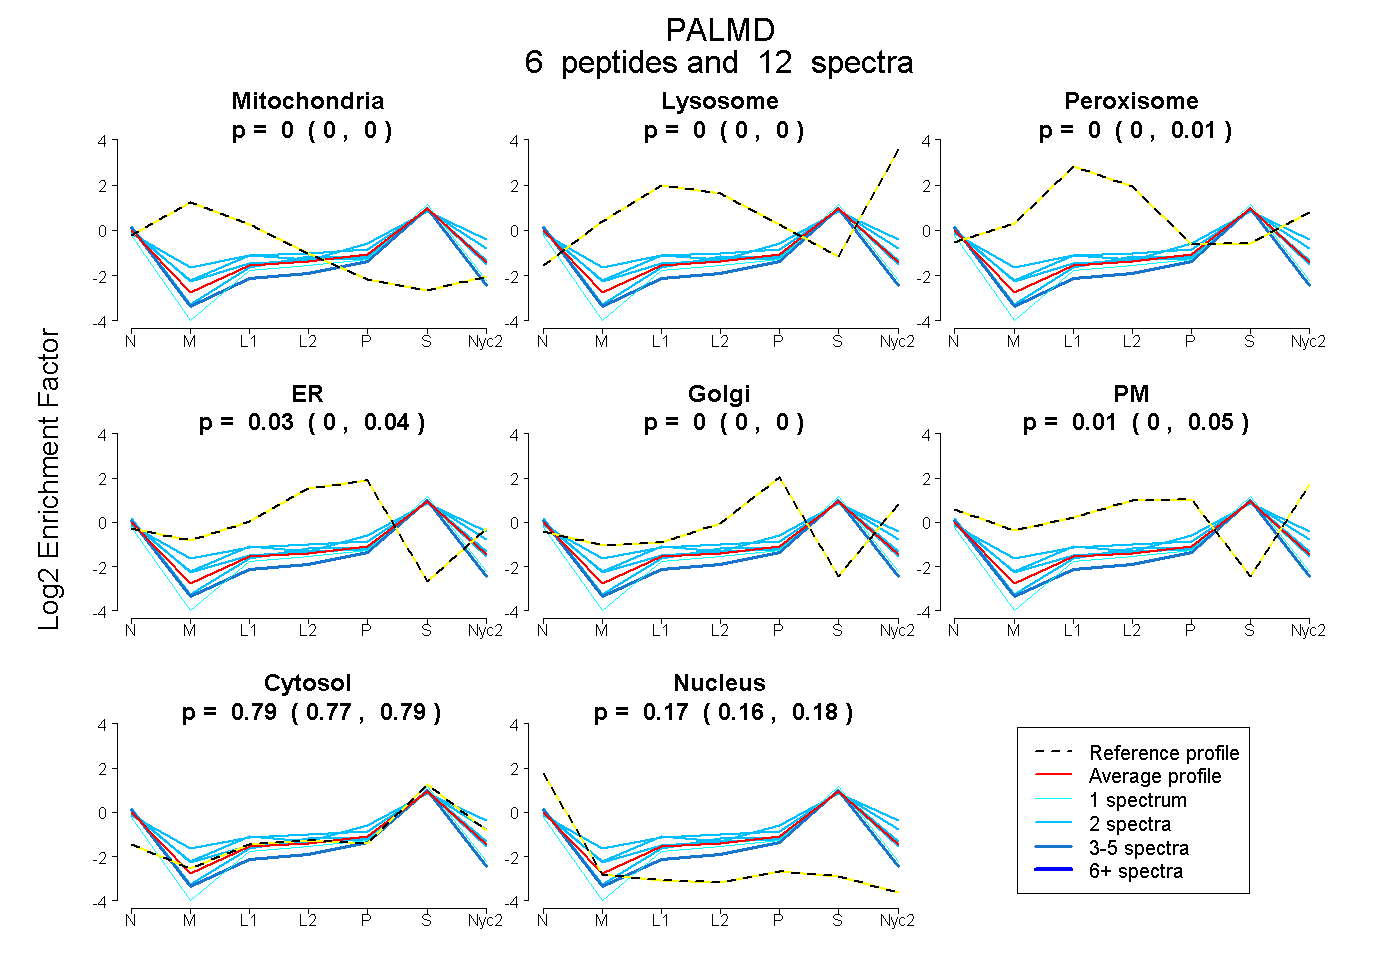
0.000 | 0.000
0.000 | 0.000
0.000 | 0.014
0.000 | 0.045
0.000 | 0.000
0.000 | 0.052
0.771 | 0.795
0.157 | 0.184
3peptides
spectra
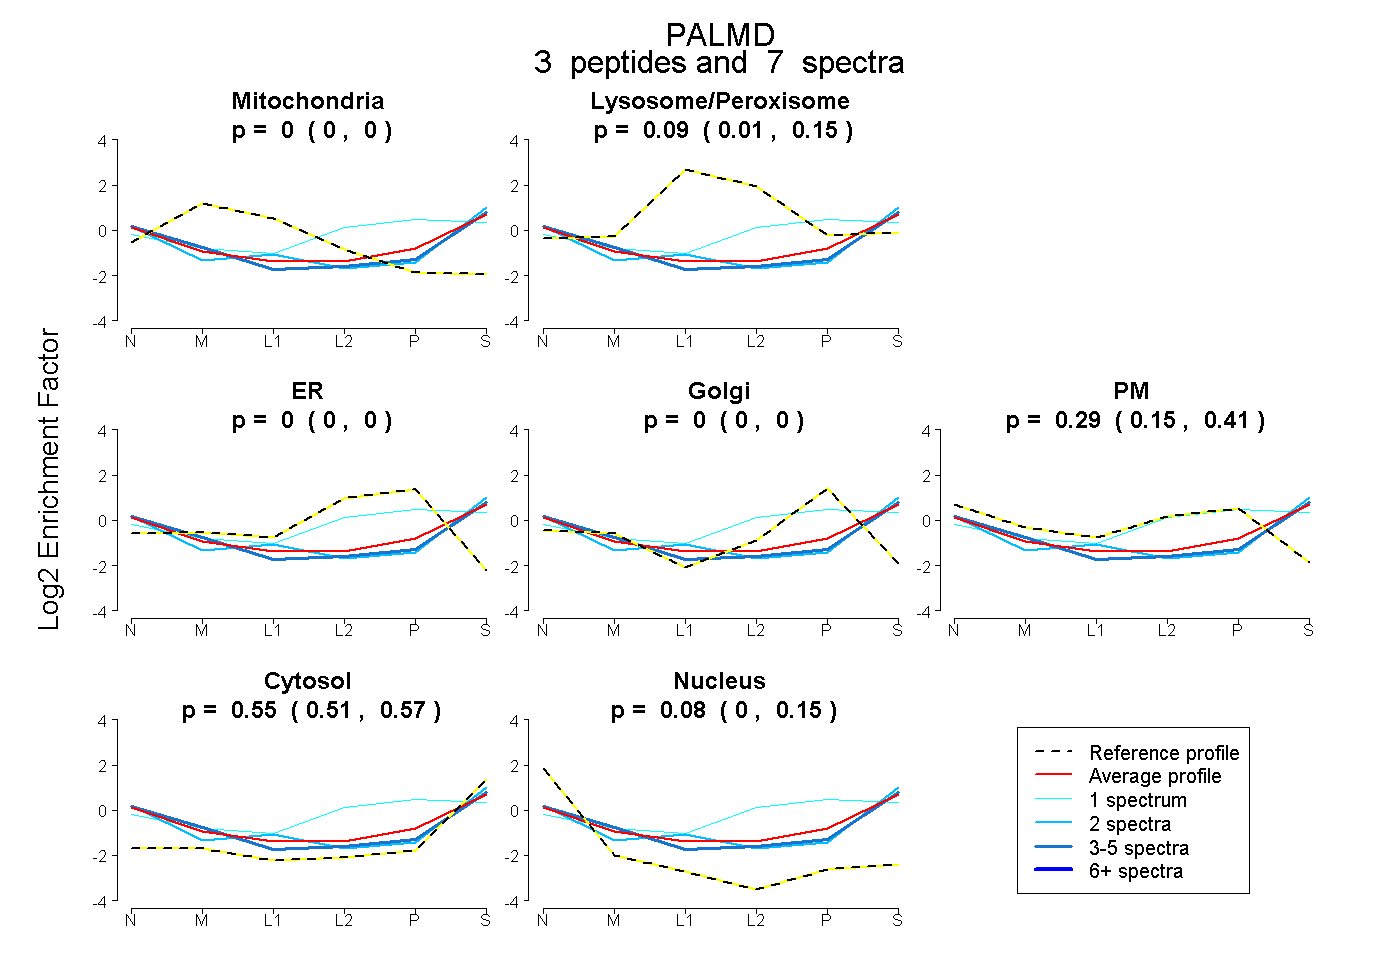
0.000 | 0.000
0.014 | 0.154
0.000 | 0.000
0.000 | 0.000
0.148 | 0.408
0.514 | 0.572
0.000 | 0.147
4peptides
spectra
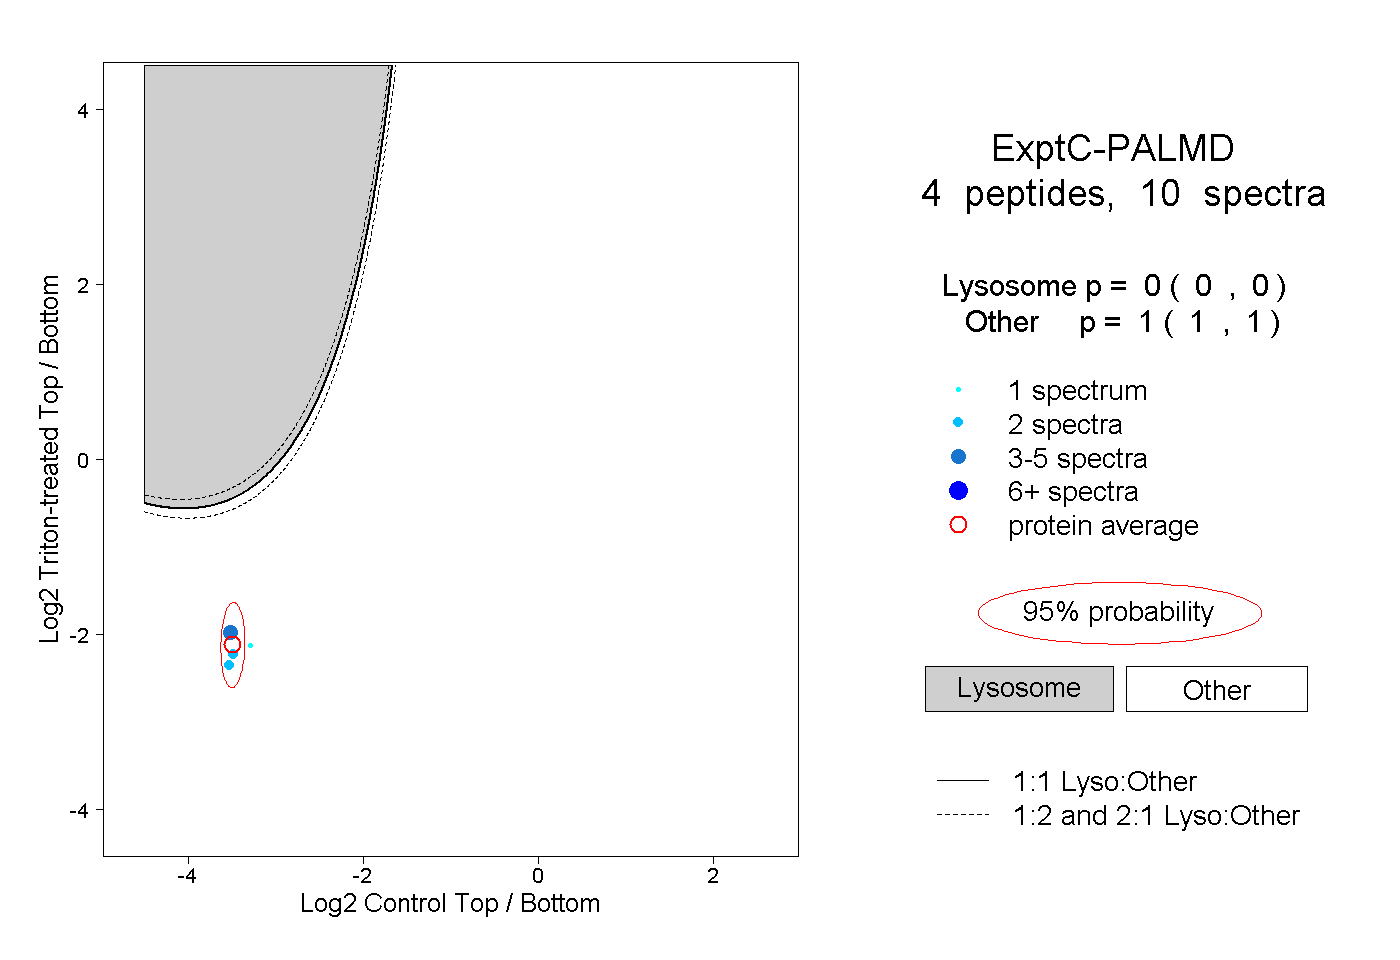
0.000 | 0.000
1.000 | 1.000
1peptide
spectrum
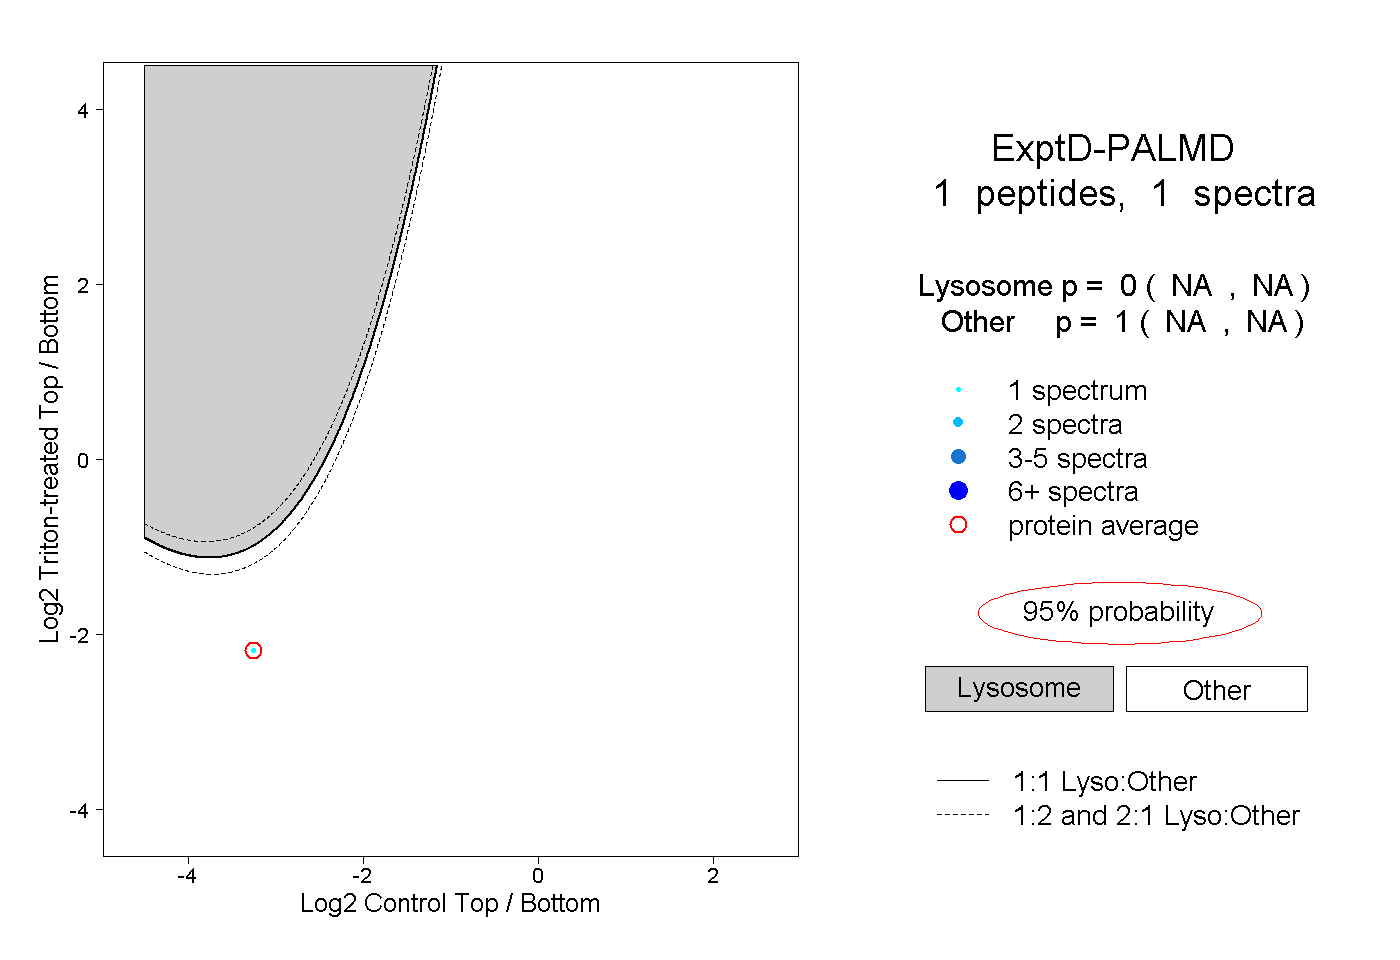
NA | NA
NA | NA