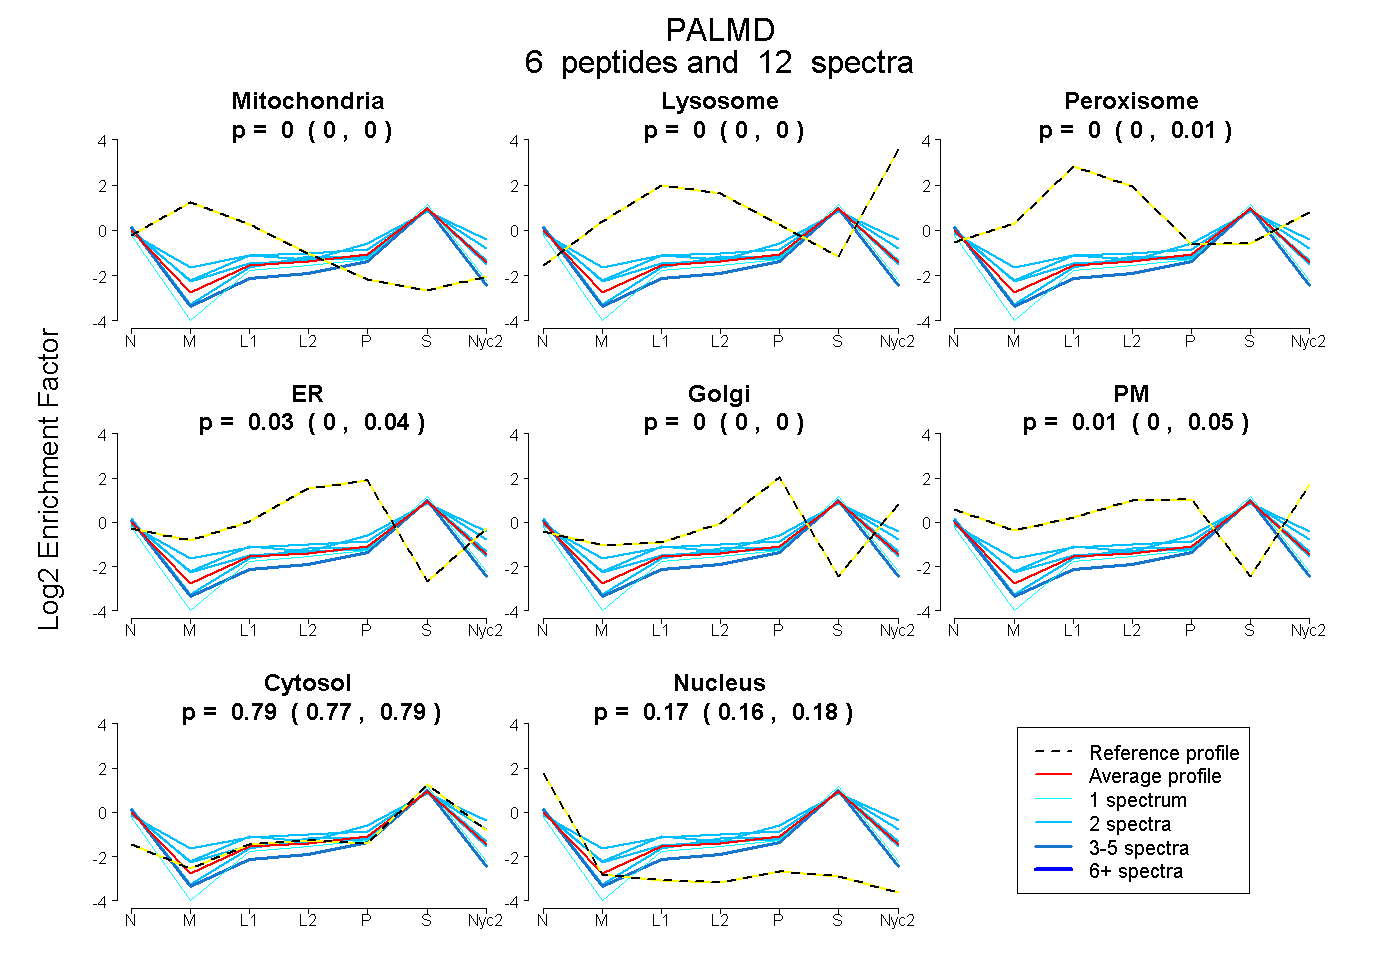
 6
6peptides
spectra
0.000 | 0.000
0.000 | 0.000
0.000 | 0.014
0.000 | 0.045
0.000 | 0.000
0.000 | 0.052
0.771 | 0.795
0.157 | 0.184
| Plot | Mito | Lyso | Perox | ER | Golgi | PM | Cytosol | Nucleus | |||||
| Expt A |
6 peptides |
12 spectra |
|
0.000 0.000 | 0.000 |
0.000 0.000 | 0.000 |
0.000 0.000 | 0.014 |
0.028 0.000 | 0.045 |
0.000 0.000 | 0.000 |
0.014 0.000 | 0.052 |
0.787 0.771 | 0.795 |
0.171 0.157 | 0.184 |
| 1 spectrum, WLLDGIGSGK | 0.000 | 0.000 | 0.000 | 0.000 | 0.000 | 0.000 | 0.780 | 0.220 | ||
| 3 spectra, VISPGPNSQER | 0.000 | 0.000 | 0.000 | 0.000 | 0.000 | 0.000 | 0.697 | 0.303 | ||
| 2 spectra, HSPLGVPGAGDGTEDPSLTALR | 0.000 | 0.000 | 0.000 | 0.000 | 0.010 | 0.173 | 0.737 | 0.081 | ||
| 2 spectra, QNEYEVSPR | 0.000 | 0.000 | 0.000 | 0.004 | 0.000 | 0.026 | 0.792 | 0.178 | ||
| 2 spectra, MPSPWEESSIR | 0.000 | 0.000 | 0.081 | 0.000 | 0.000 | 0.124 | 0.706 | 0.089 | ||
| 2 spectra, IQEEISQK | 0.000 | 0.000 | 0.107 | 0.000 | 0.000 | 0.000 | 0.714 | 0.179 |
| Plot | Mito | Lyso or Perox | ER | Golgi | PM | Cytosol | Nucleus | ||||||
| Expt B |
3 peptides |
7 spectra |
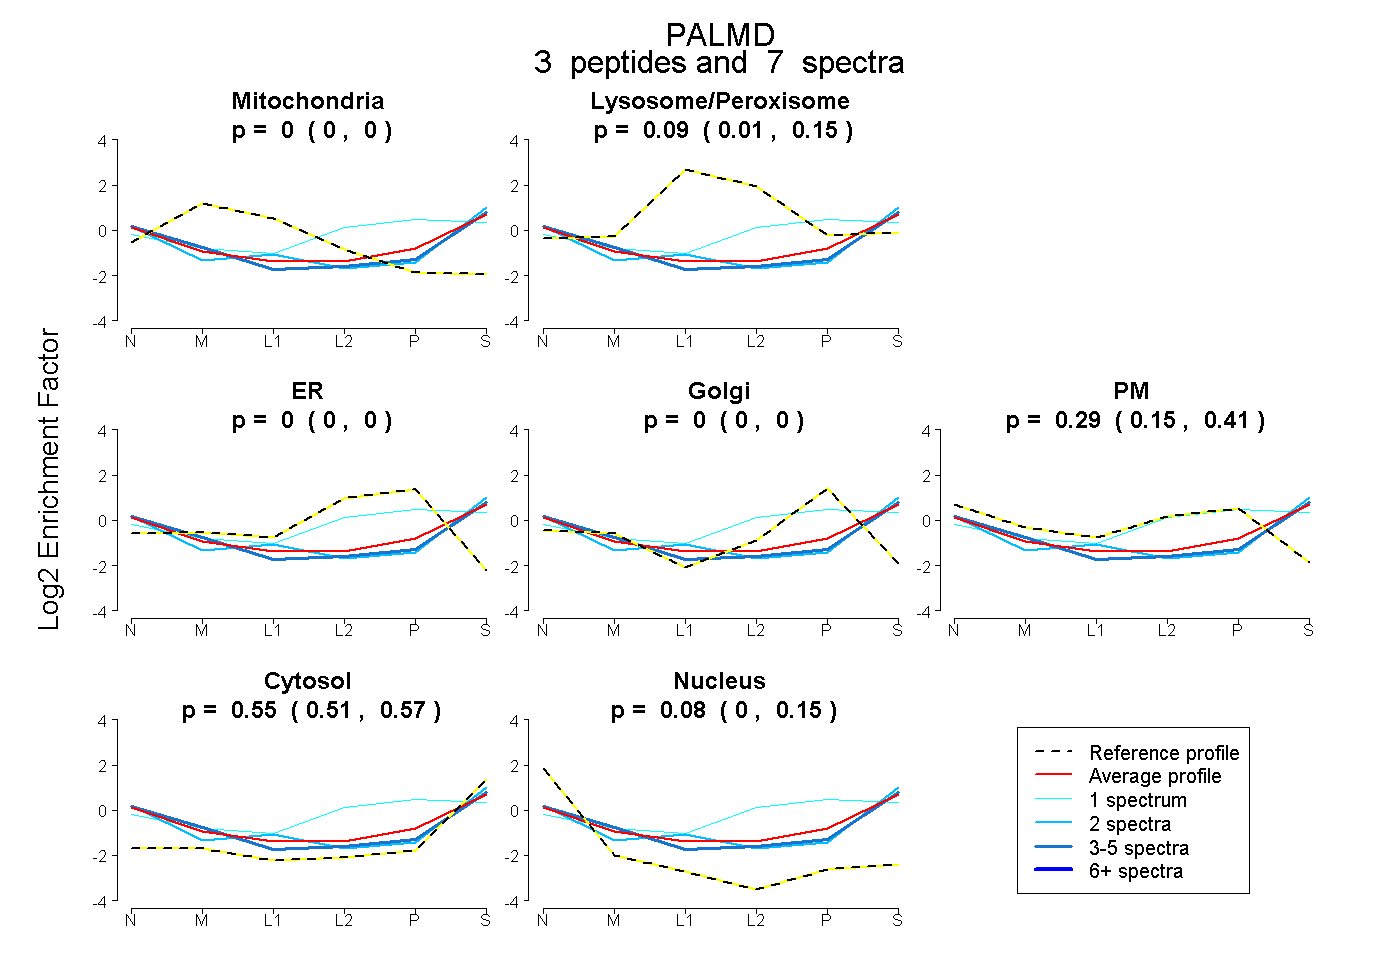 |
0.000 0.000 | 0.000 |
0.088 0.014 | 0.154 |
0.000 0.000 | 0.000 |
0.000 0.000 | 0.000 |
0.287 0.148 | 0.408 |
0.549 0.514 | 0.572 |
0.076 0.000 | 0.147 |
|||
| Plot | Lyso | Other | |||||||||||
| Expt C |
4 peptides |
10 spectra |
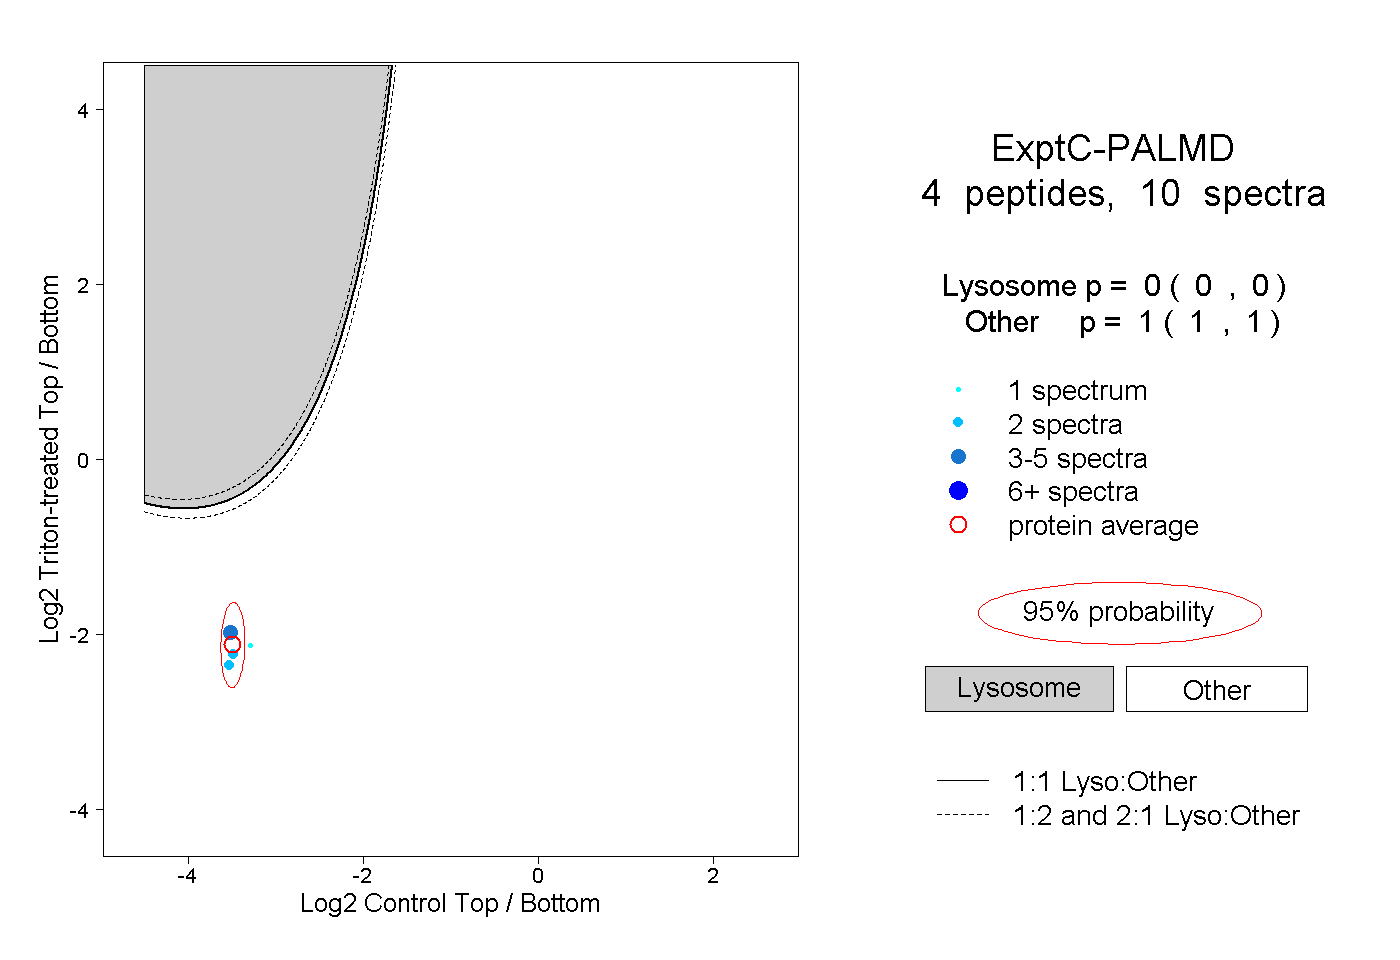 |
0.000 0.000 | 0.000 |
1.000 1.000 | 1.000 |
||||||||
| Plot | Lyso | Other | |||||||||||
| Expt D |
1 peptide |
1 spectrum |
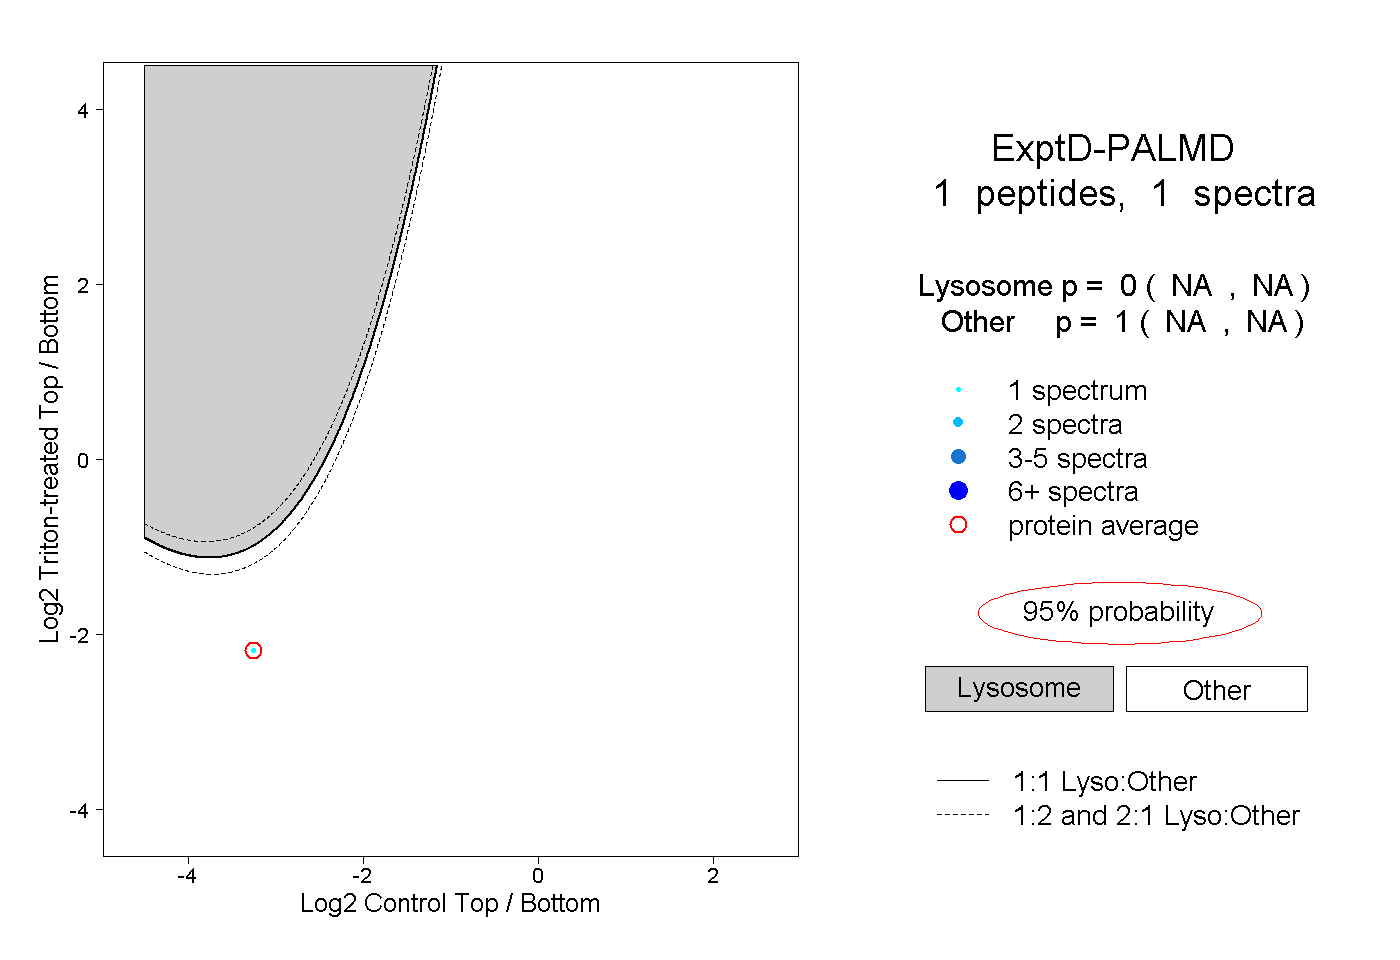 |
0.000 NA | NA |
1.000 NA | NA |