 5
5peptides
spectra
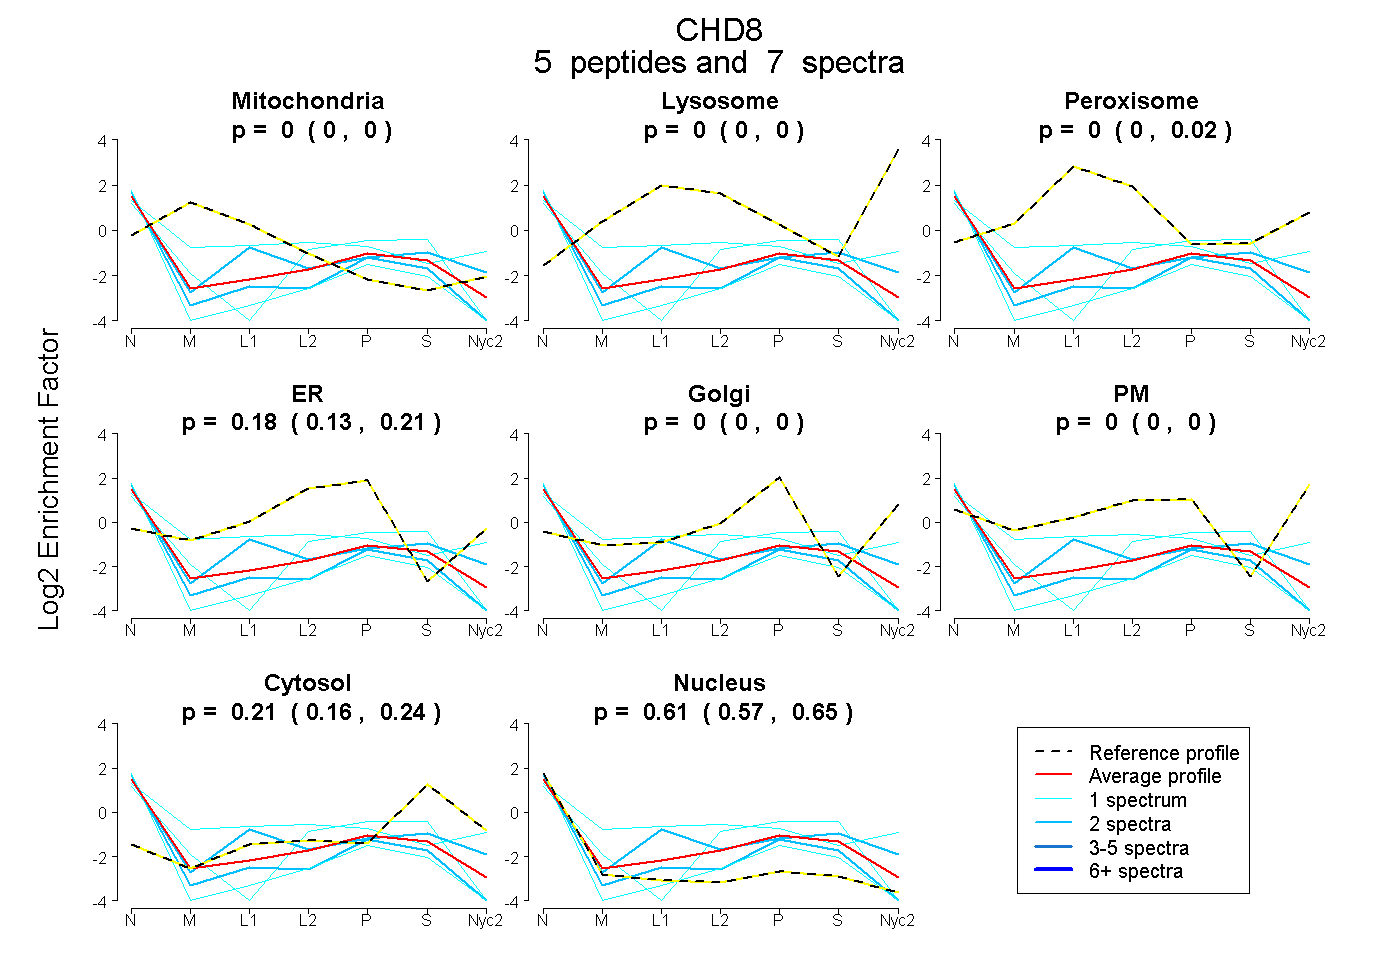
0.000 | 0.000
0.000 | 0.000
0.000 | 0.022
0.129 | 0.212
0.000 | 0.000
0.000 | 0.000
0.158 | 0.244
0.569 | 0.653
1peptide
spectrum
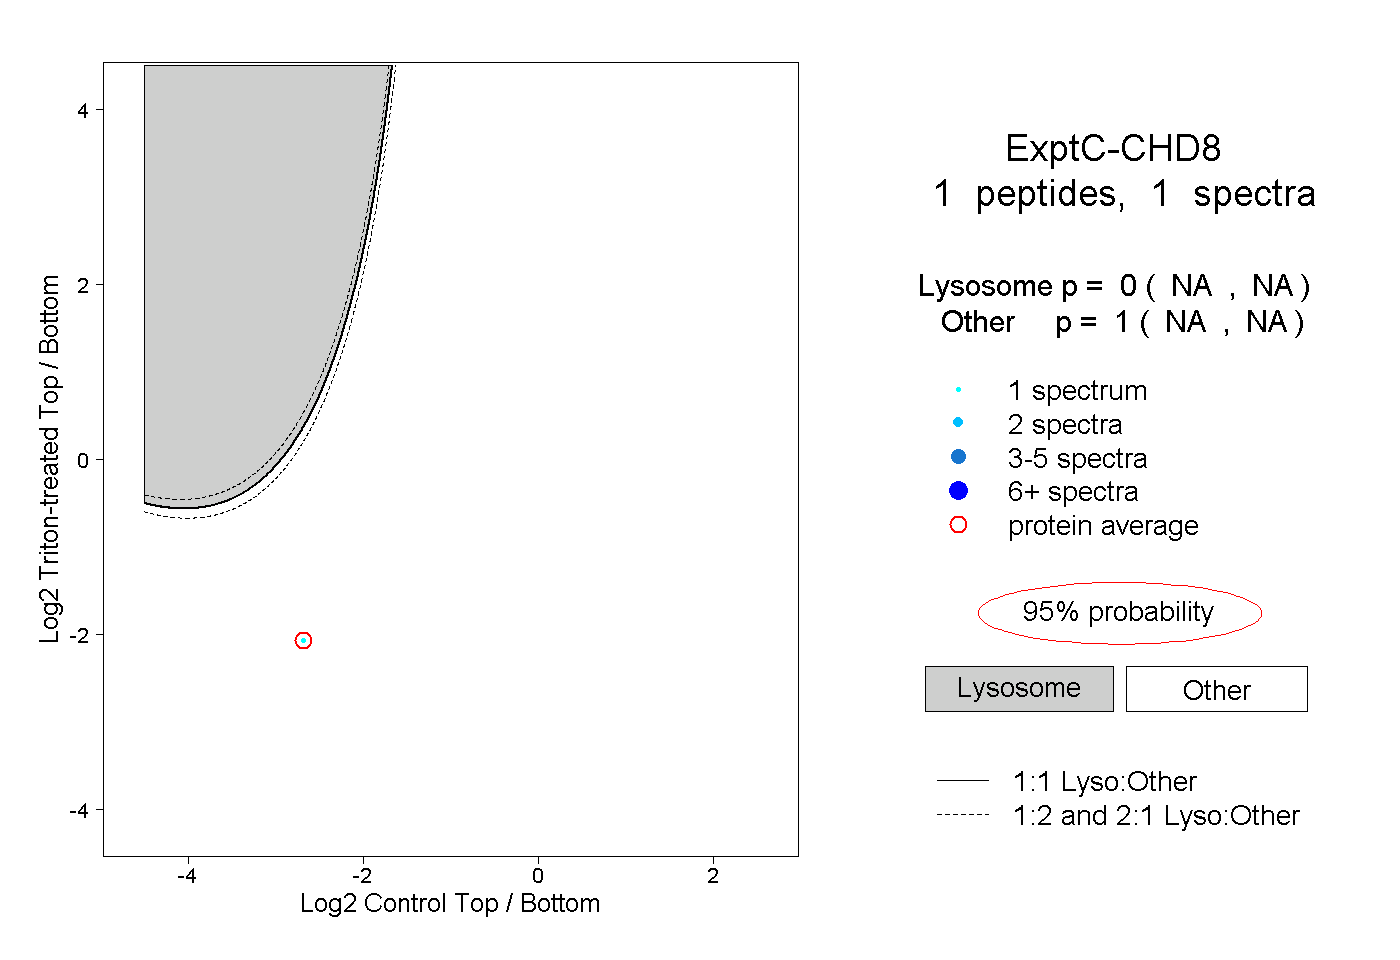
NA | NA
NA | NA
| Plot | Mito | Lyso | Perox | ER | Golgi | PM | Cytosol | Nucleus | |||||
| Expt A |
5 peptides |
7 spectra |
|
0.000 0.000 | 0.000 |
0.000 0.000 | 0.000 |
0.000 0.000 | 0.022 |
0.181 0.129 | 0.212 |
0.000 0.000 | 0.000 |
0.000 0.000 | 0.000 |
0.206 0.158 | 0.244 |
0.613 0.569 | 0.653 |
||
| Plot | Lyso | Other | |||||||||||
| Expt C |
1 peptide |
1 spectrum |
|
0.000 NA | NA |
1.000 NA | NA |