 5
5peptides
spectra
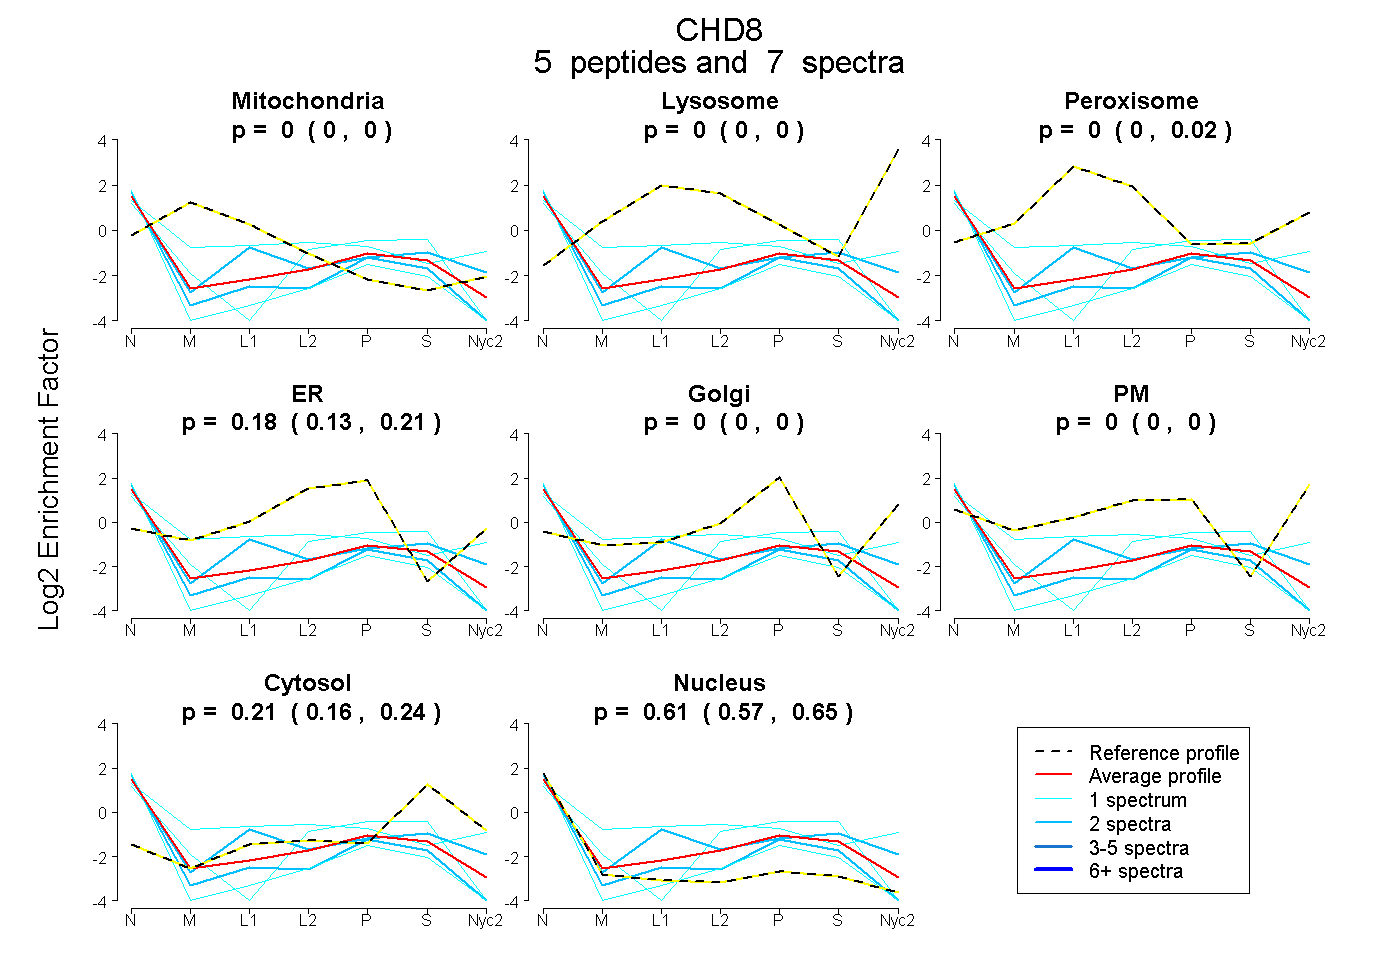
0.000 | 0.000
0.000 | 0.000
0.000 | 0.022
0.129 | 0.212
0.000 | 0.000
0.000 | 0.000
0.158 | 0.244
0.569 | 0.653
| Plot | Mito | Lyso | Perox | ER | Golgi | PM | Cytosol | Nucleus | |||||
| Expt A |
5 peptides |
7 spectra |
|
0.000 0.000 | 0.000 |
0.000 0.000 | 0.000 |
0.000 0.000 | 0.022 |
0.181 0.129 | 0.212 |
0.000 0.000 | 0.000 |
0.000 0.000 | 0.000 |
0.206 0.158 | 0.244 |
0.613 0.569 | 0.653 |
| 1 spectrum, EIEDLLR | 0.000 | 0.000 | 0.000 | 0.004 | 0.000 | 0.000 | 0.101 | 0.896 | ||
| 2 spectra, LEDEVVAR | 0.000 | 0.000 | 0.189 | 0.000 | 0.000 | 0.070 | 0.224 | 0.517 | ||
| 2 spectra, AVLQSMSGR | 0.000 | 0.000 | 0.000 | 0.062 | 0.000 | 0.000 | 0.131 | 0.807 | ||
| 1 spectrum, TDISLDDPNFWQK | 0.020 | 0.000 | 0.243 | 0.000 | 0.000 | 0.312 | 0.035 | 0.391 | ||
| 1 spectrum, ADPALCFLEK | 0.000 | 0.000 | 0.000 | 0.144 | 0.000 | 0.000 | 0.270 | 0.587 |
| Plot | Lyso | Other | |||||||||||
| Expt C |
1 peptide |
1 spectrum |
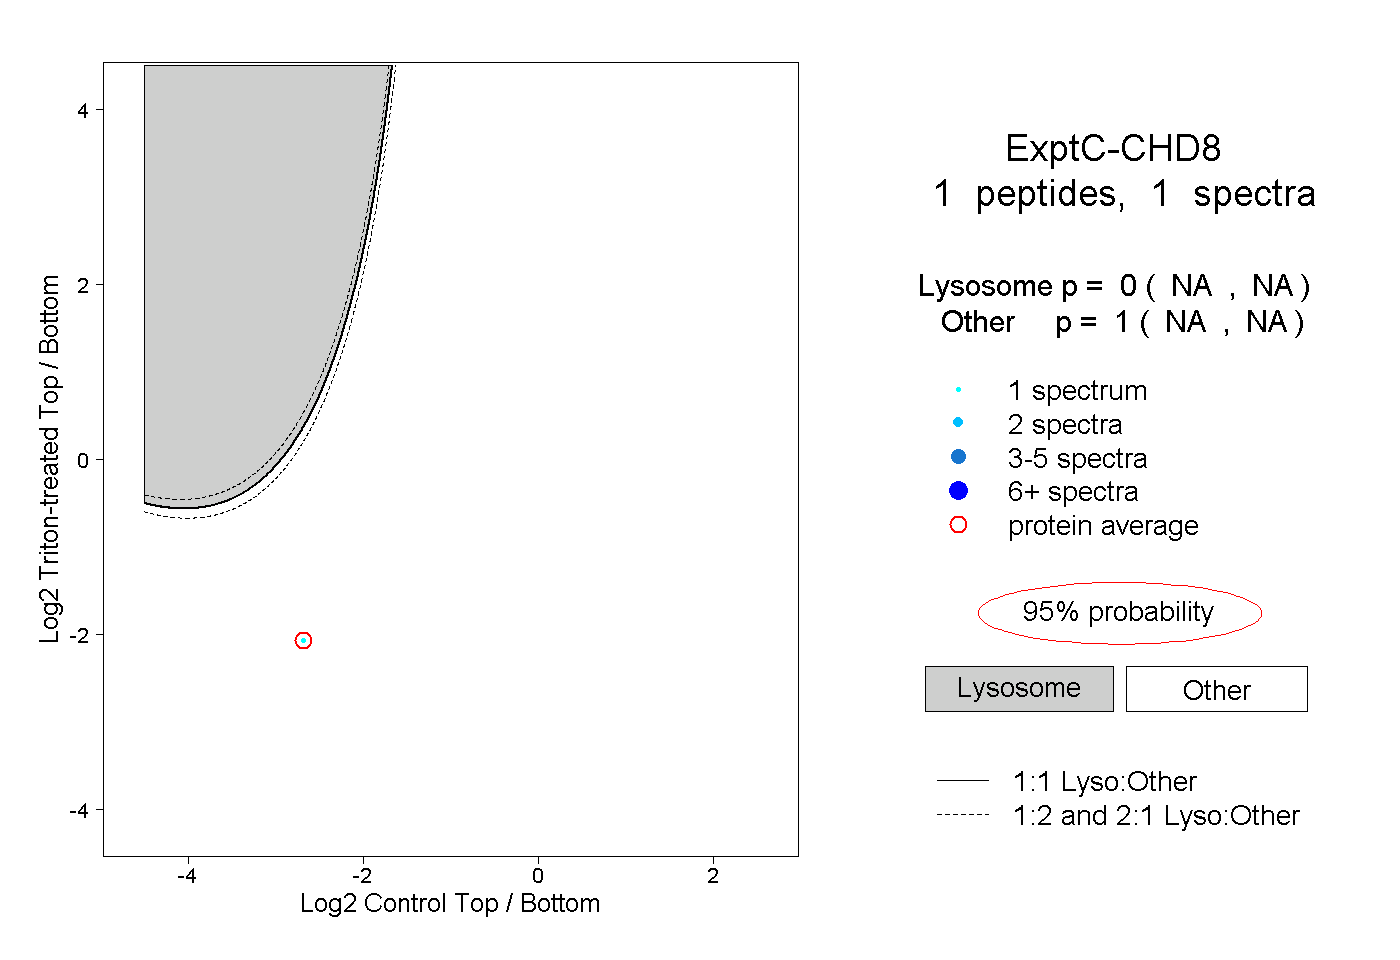 |
0.000 NA | NA |
1.000 NA | NA |