 13
13peptides
spectra
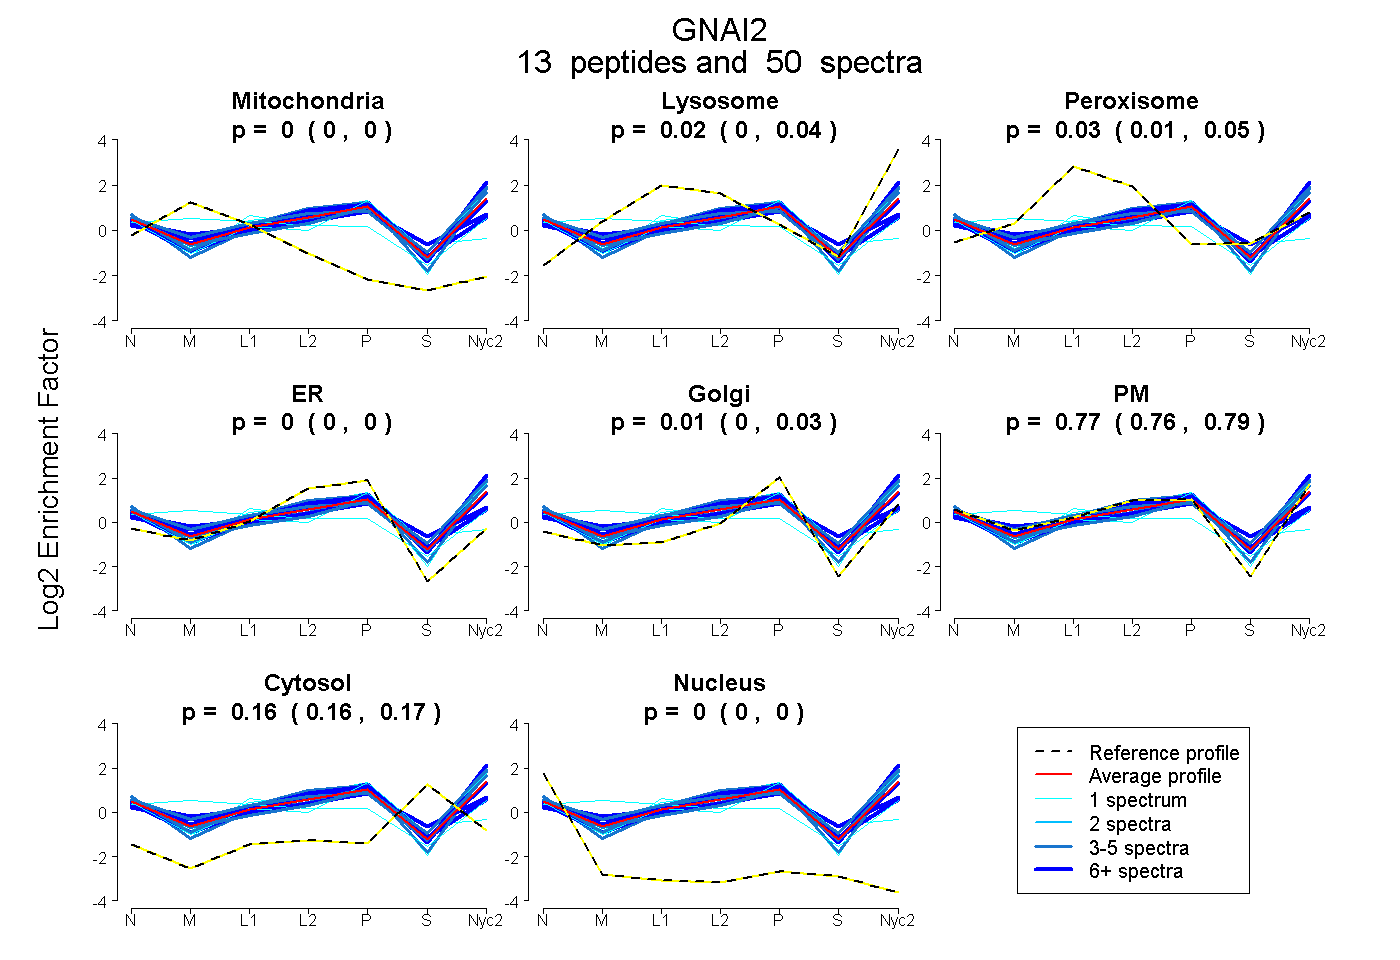
0.000 | 0.000
0.004 | 0.036
0.015 | 0.048
0.000 | 0.000
0.000 | 0.026
0.756 | 0.787
0.156 | 0.166
0.000 | 0.000
2peptides
spectra
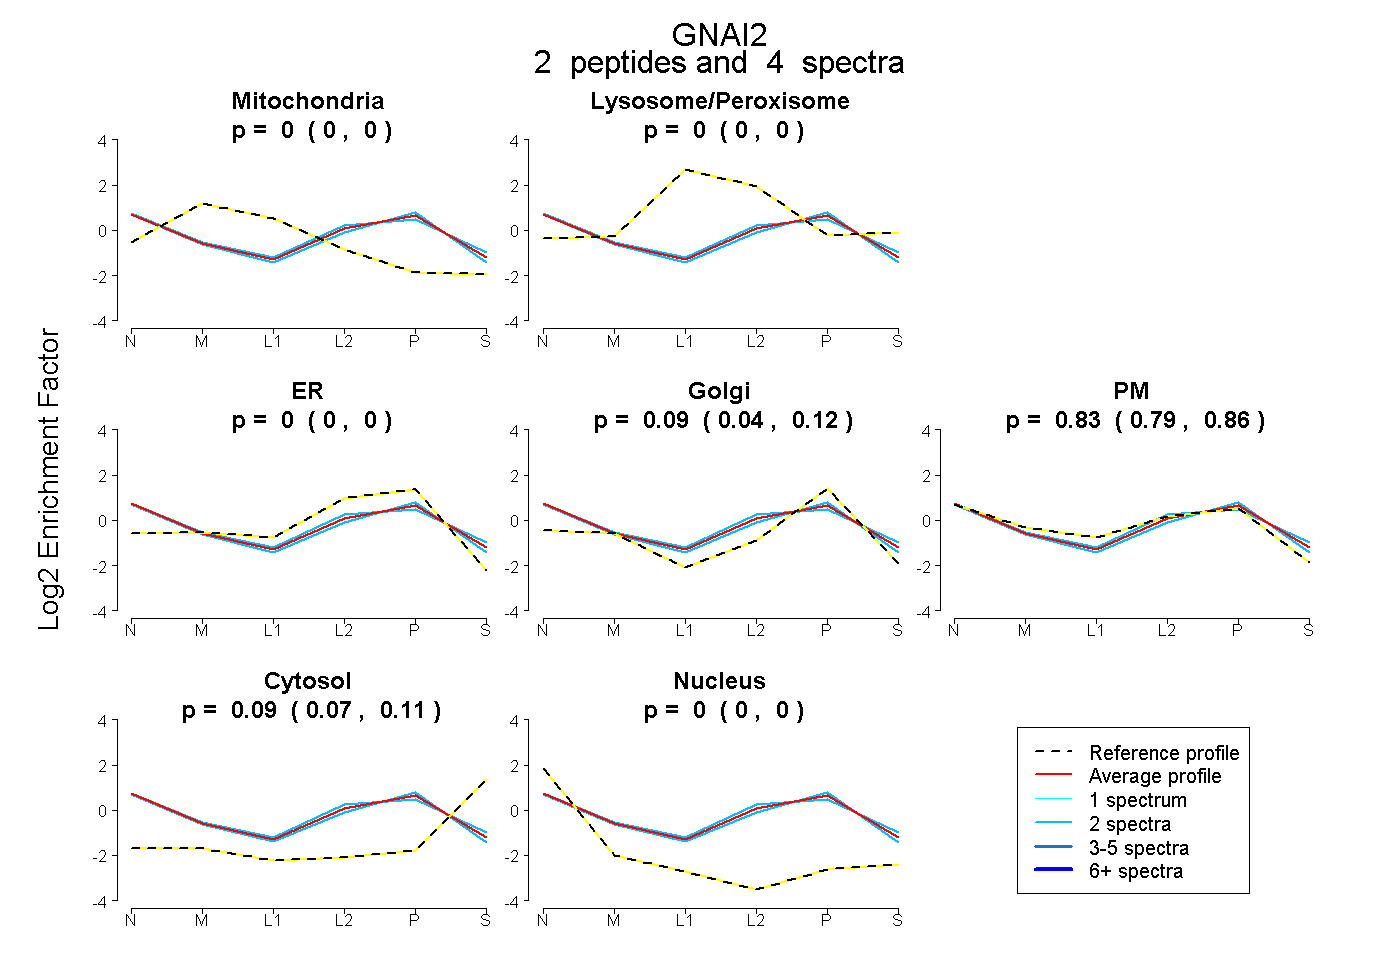
0.000 | 0.000
0.000 | 0.000
0.000 | 0.000
0.043 | 0.122
0.789 | 0.856
0.069 | 0.106
0.000 | 0.000
12peptides
spectra
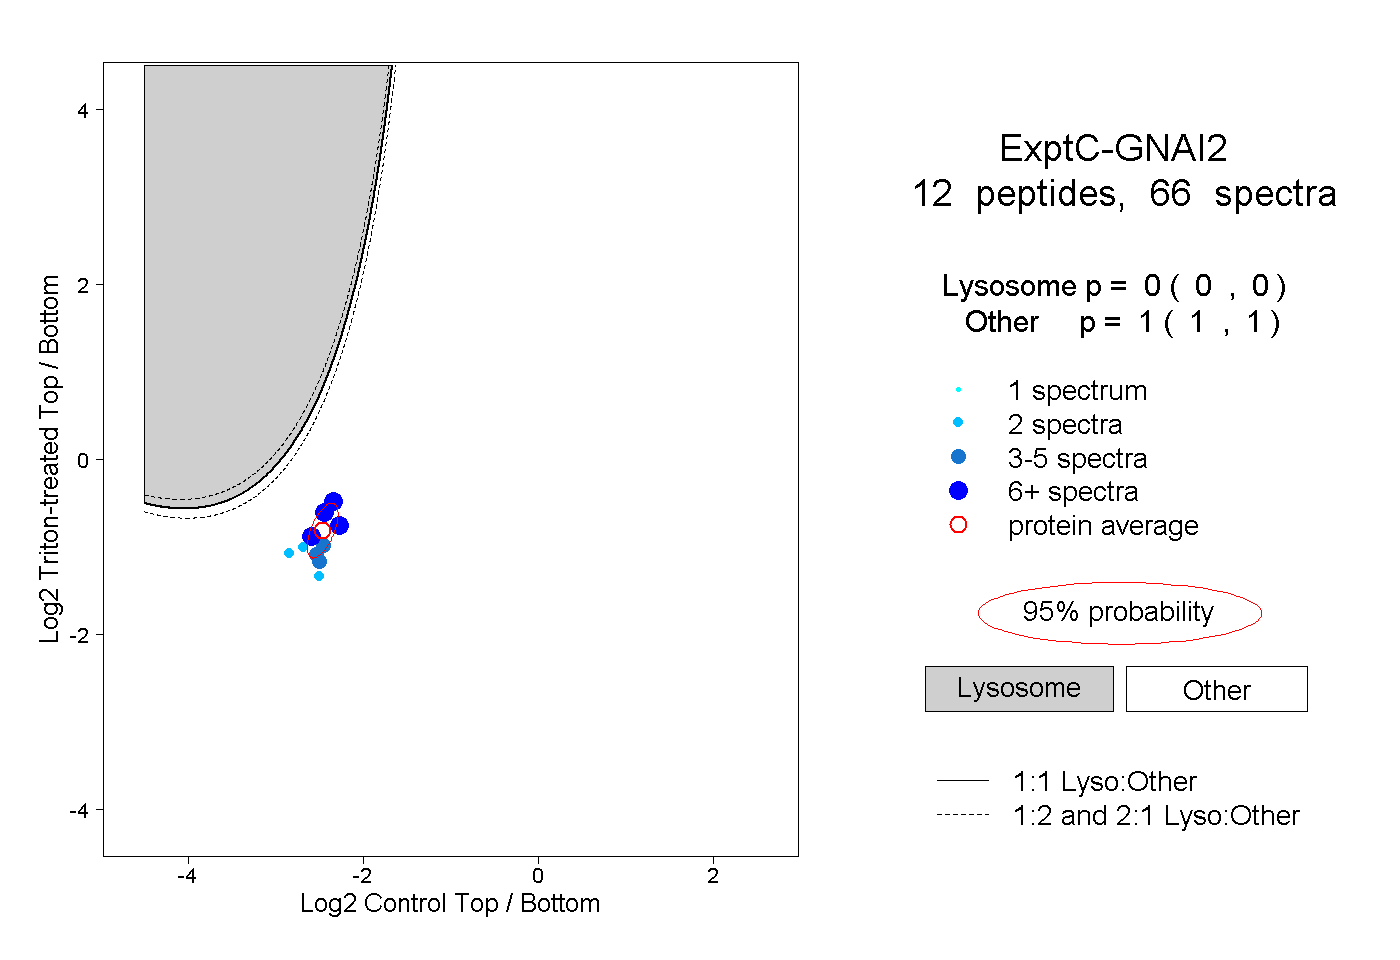
0.000 | 0.000
1.000 | 1.000
2peptides
spectra
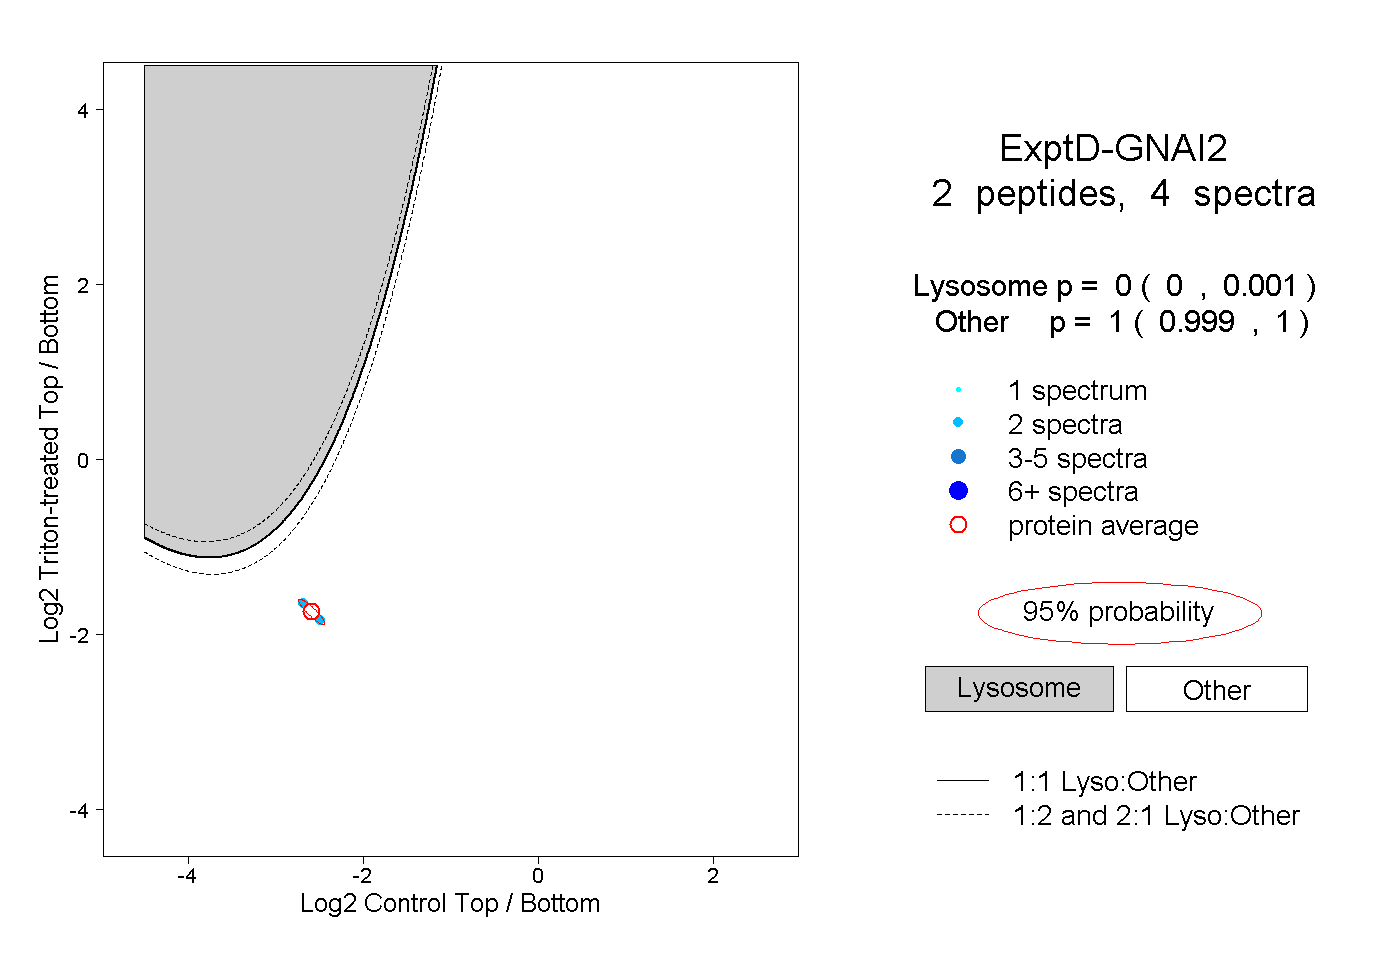
0.000 | 0.001
0.999 | 1.000