 13
13peptides
spectra
0.000 | 0.000
0.004 | 0.036
0.015 | 0.048
0.000 | 0.000
0.000 | 0.026
0.756 | 0.787
0.156 | 0.166
0.000 | 0.000
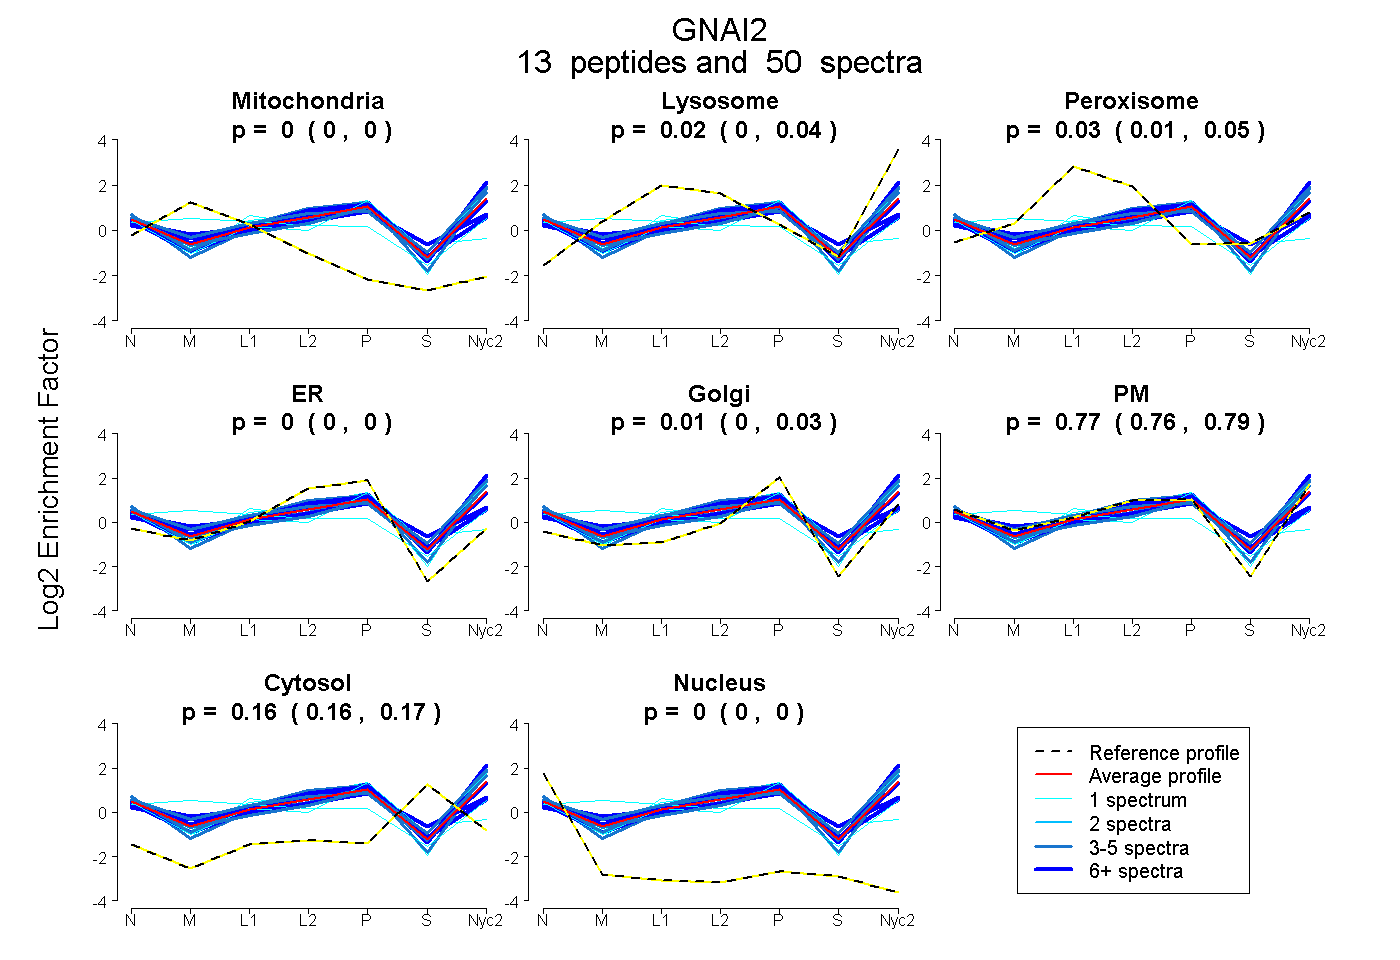
| Plot | Mito | Lyso | Perox | ER | Golgi | PM | Cytosol | Nucleus | |||||
| Expt A |
13 peptides |
50 spectra |
|
0.000 0.000 | 0.000 |
0.021 0.004 | 0.036 |
0.032 0.015 | 0.048 |
0.000 0.000 | 0.000 |
0.011 0.000 | 0.026 |
0.775 0.756 | 0.787 |
0.161 0.156 | 0.166 |
0.000 0.000 | 0.000 |
| 1 spectrum, NVQFVFDAVTDVIIK | 0.252 | 0.010 | 0.126 | 0.000 | 0.013 | 0.539 | 0.061 | 0.000 | ||
| 1 spectrum, AMGNLQIDFADPQR | 0.000 | 0.127 | 0.000 | 0.000 | 0.000 | 0.780 | 0.093 | 0.000 | ||
| 4 spectra, YDEAASYIQSK | 0.000 | 0.084 | 0.000 | 0.000 | 0.001 | 0.727 | 0.188 | 0.000 | ||
| 3 spectra, IAQSDYIPTQQDVLR | 0.000 | 0.020 | 0.000 | 0.000 | 0.003 | 0.828 | 0.148 | 0.000 | ||
| 5 spectra, LLLLGAGESGK | 0.000 | 0.032 | 0.000 | 0.000 | 0.000 | 0.912 | 0.056 | 0.000 | ||
| 1 spectrum, MHESMK | 0.000 | 0.098 | 0.000 | 0.000 | 0.178 | 0.553 | 0.171 | 0.000 | ||
| 9 spectra, IIHEDGYSEEECR | 0.000 | 0.000 | 0.039 | 0.259 | 0.019 | 0.487 | 0.196 | 0.000 | ||
| 3 spectra, TTGIVETHFTFK | 0.000 | 0.068 | 0.069 | 0.000 | 0.000 | 0.752 | 0.112 | 0.000 | ||
| 1 spectrum, FEDLNK | 0.000 | 0.007 | 0.000 | 0.000 | 0.075 | 0.888 | 0.030 | 0.000 | ||
| 8 spectra, MFDVGGQR | 0.000 | 0.139 | 0.000 | 0.000 | 0.000 | 0.775 | 0.086 | 0.000 | ||
| 1 spectrum, EIYTHFTCATDTK | 0.000 | 0.000 | 0.263 | 0.306 | 0.097 | 0.074 | 0.198 | 0.062 | ||
| 6 spectra, LFDSICNNK | 0.000 | 0.021 | 0.097 | 0.000 | 0.031 | 0.708 | 0.143 | 0.000 | ||
| 7 spectra, LWADHGVQACFGR | 0.000 | 0.000 | 0.171 | 0.000 | 0.172 | 0.432 | 0.225 | 0.000 |
| Plot | Mito | Lyso or Perox | ER | Golgi | PM | Cytosol | Nucleus | ||||||
| Expt B |
2 peptides |
4 spectra |
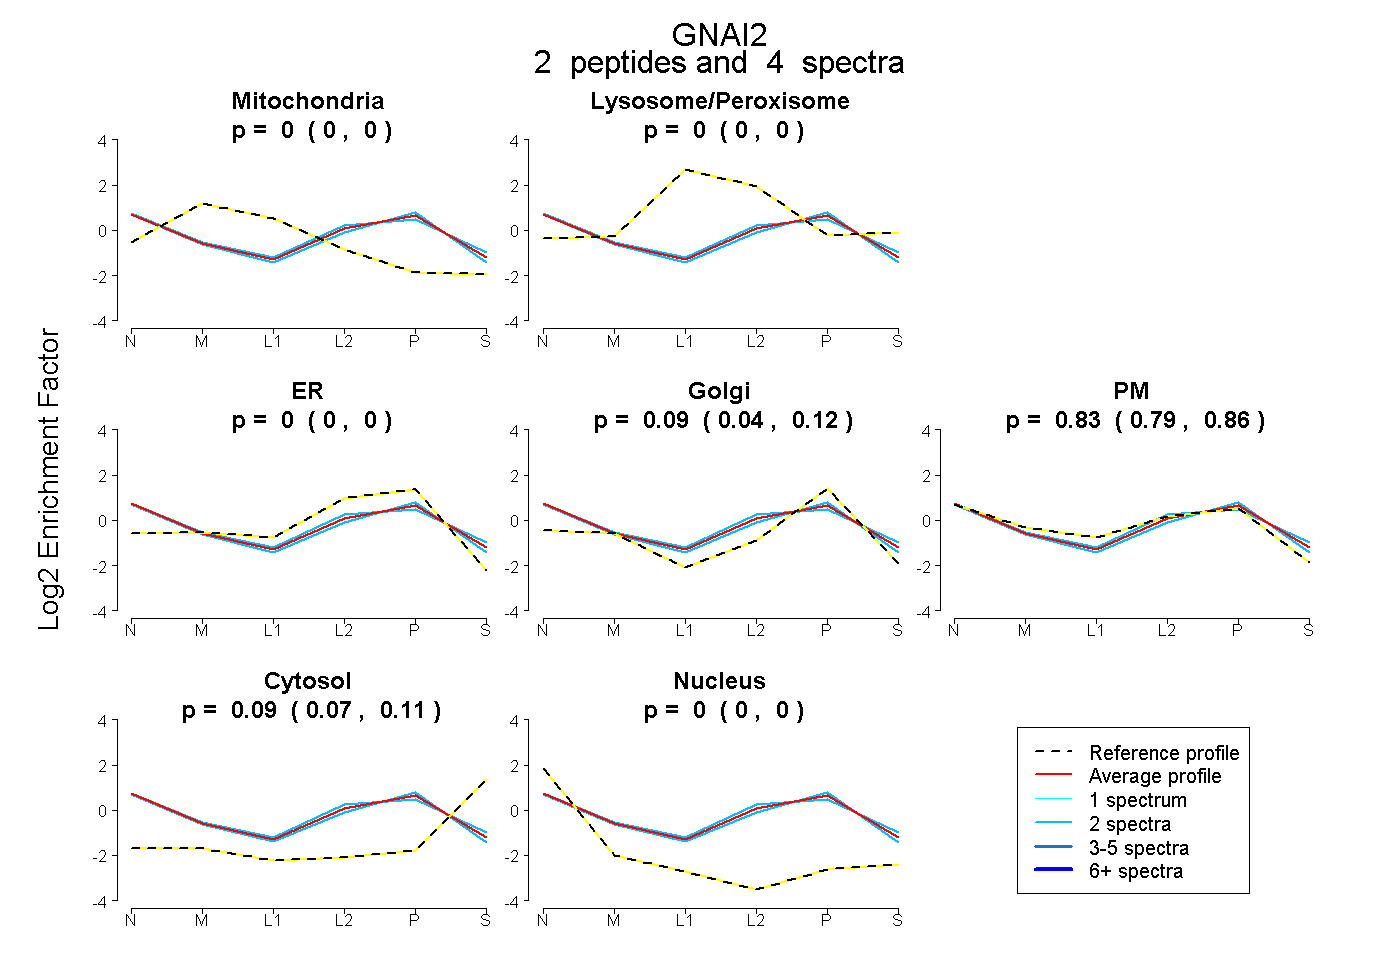 |
0.000 0.000 | 0.000 |
0.000 0.000 | 0.000 |
0.000 0.000 | 0.000 |
0.085 0.043 | 0.122 |
0.826 0.789 | 0.856 |
0.089 0.069 | 0.106 |
0.000 0.000 | 0.000 |
|||
| Plot | Lyso | Other | |||||||||||
| Expt C |
12 peptides |
66 spectra |
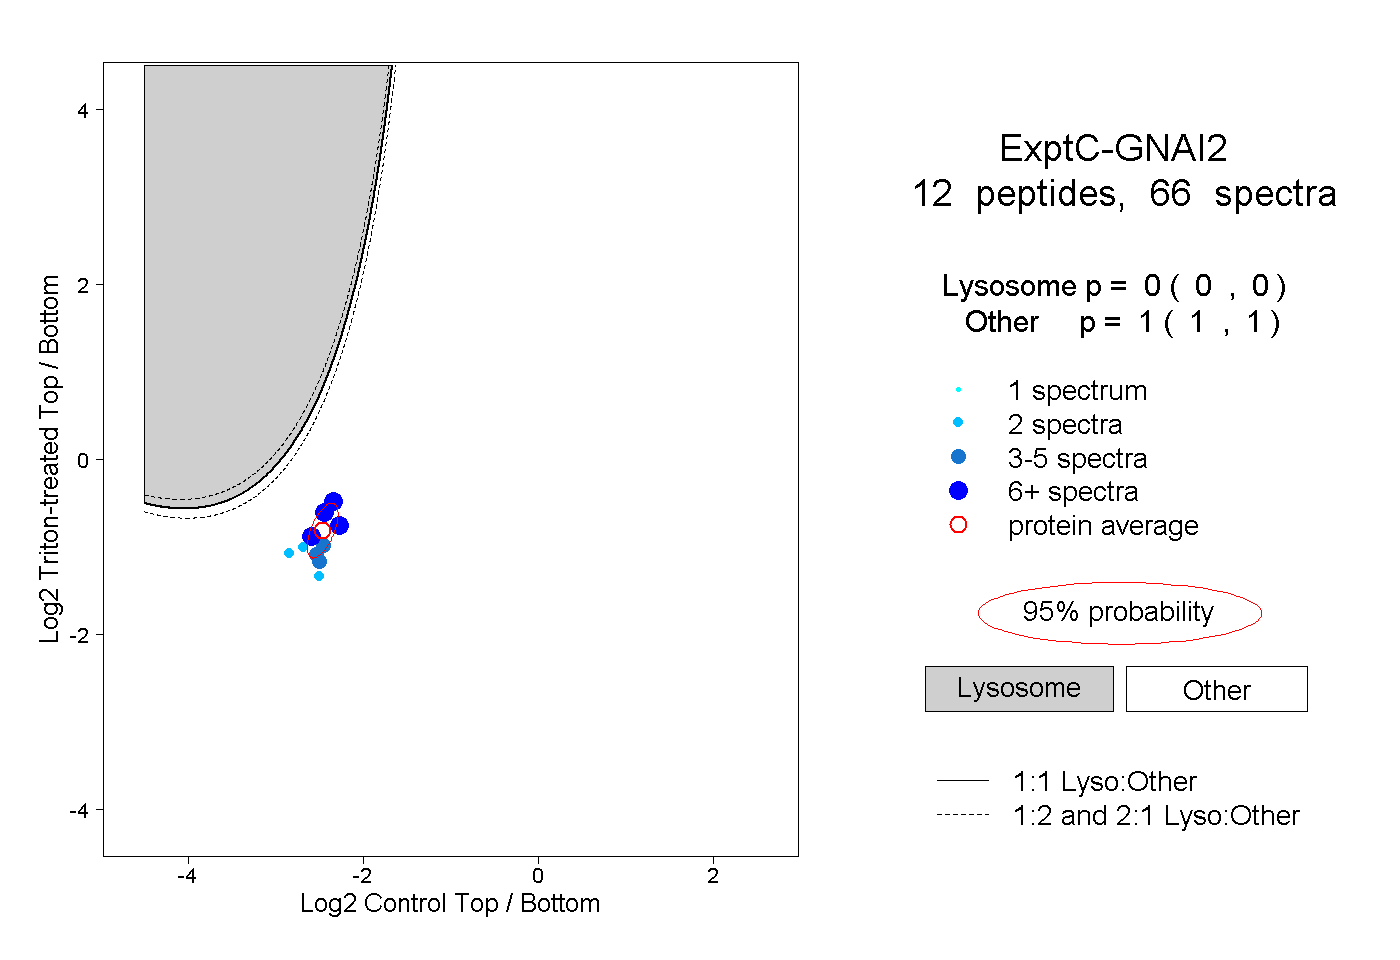 |
0.000 0.000 | 0.000 |
1.000 1.000 | 1.000 |
||||||||
| Plot | Lyso | Other | |||||||||||
| Expt D |
2 peptides |
4 spectra |
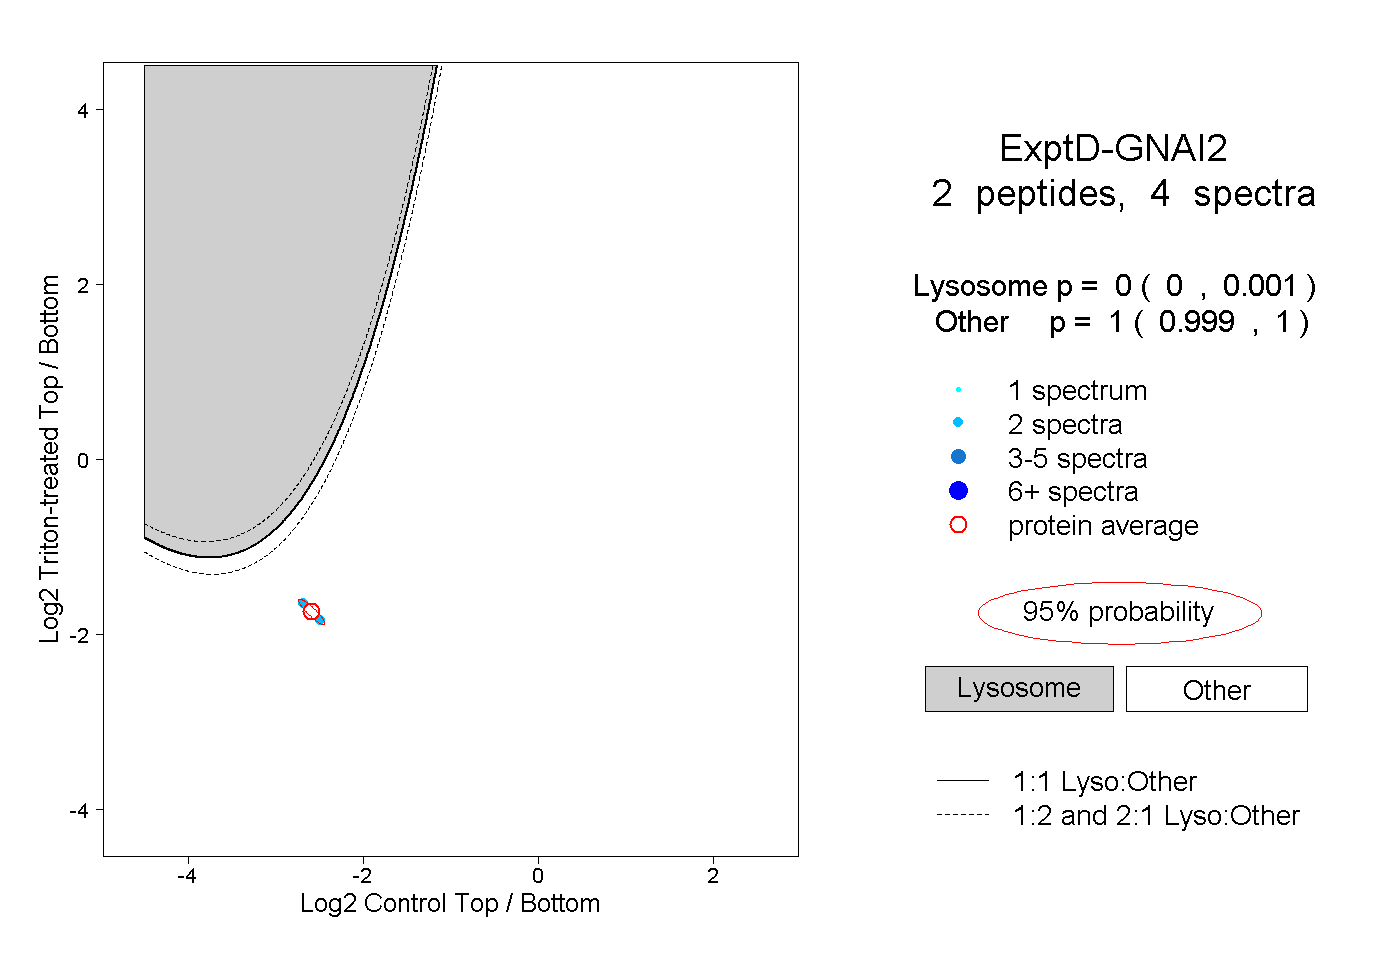 |
0.000 0.000 | 0.001 |
1.000 0.999 | 1.000 |