 3
3peptides
spectra
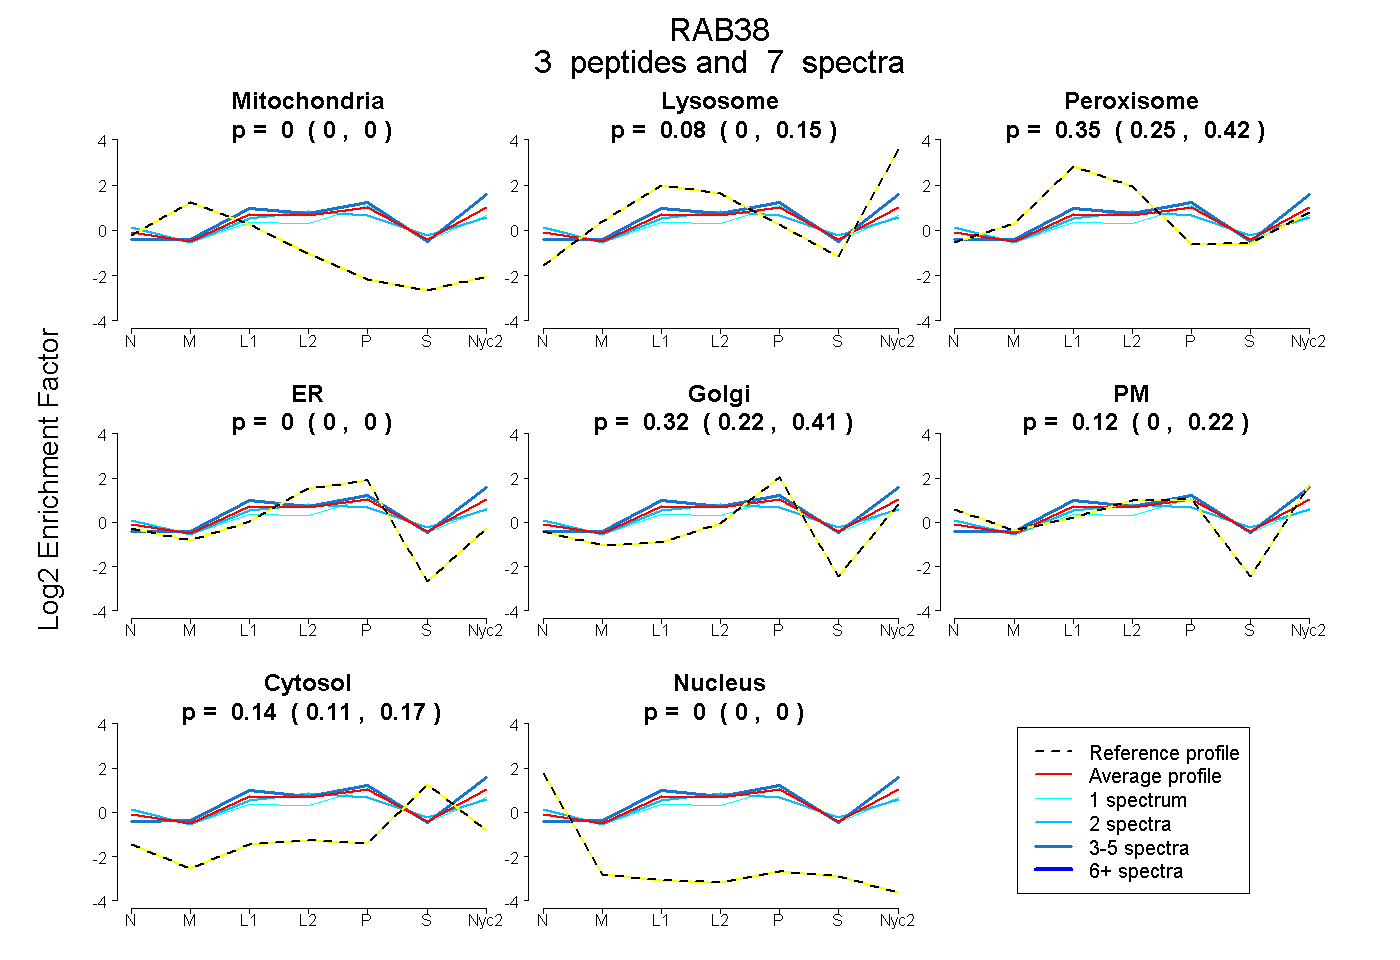
0.000 | 0.000
0.000 | 0.149
0.248 | 0.417
0.000 | 0.000
0.216 | 0.412
0.000 | 0.223
0.107 | 0.166
0.000 | 0.000
2peptides
spectra
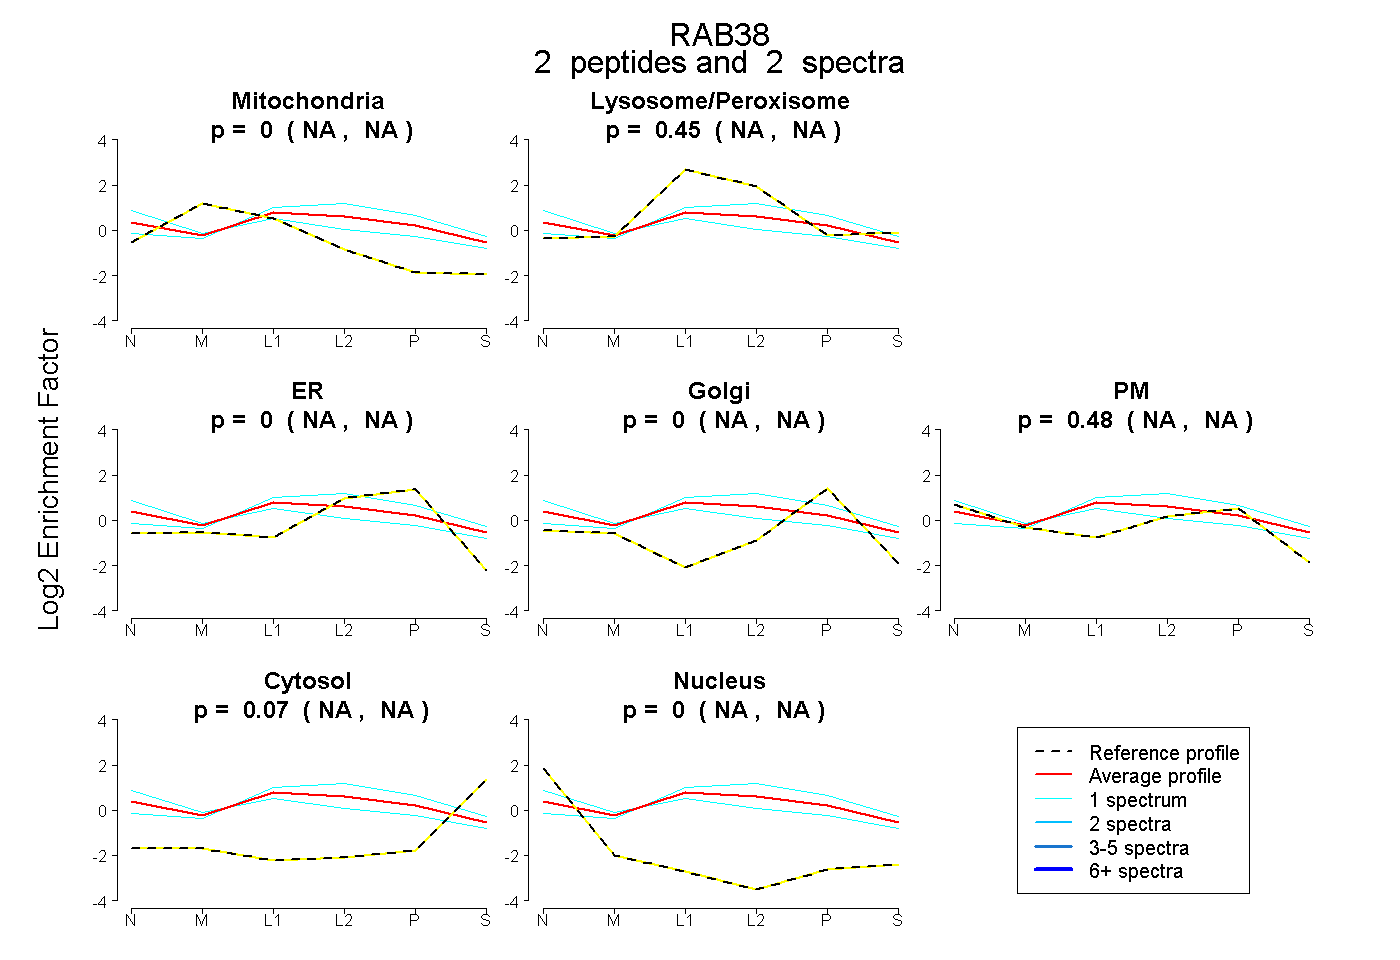
NA | NA
NA | NA
NA | NA
NA | NA
NA | NA
NA | NA
NA | NA
4peptides
spectra

0.000 | 0.626
0.366 | 1.000
1peptide
spectrum
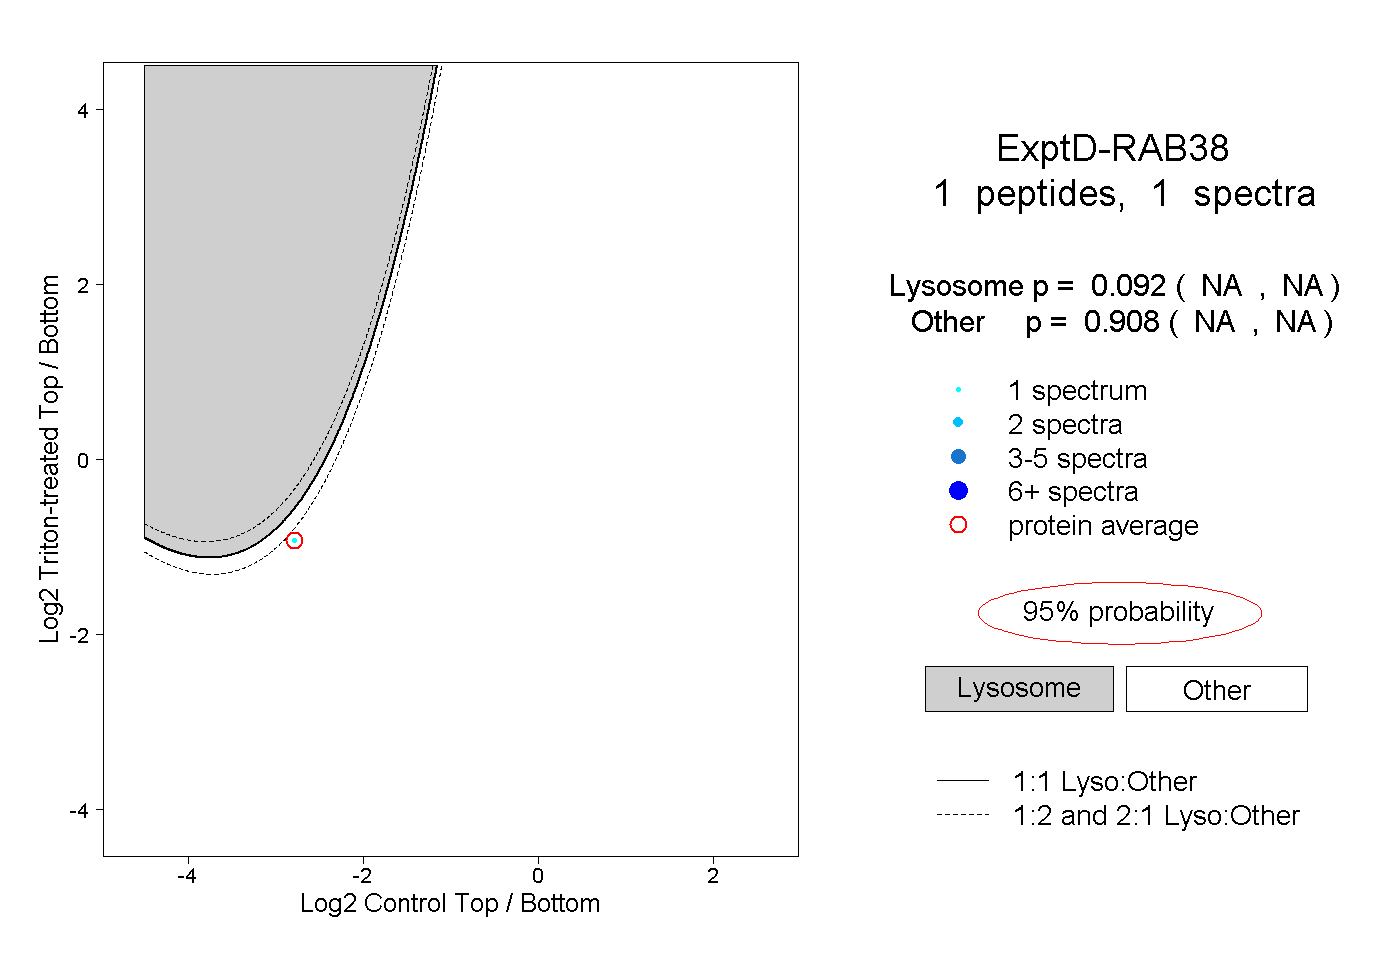
NA | NA
NA | NA