 3
3peptides
spectra
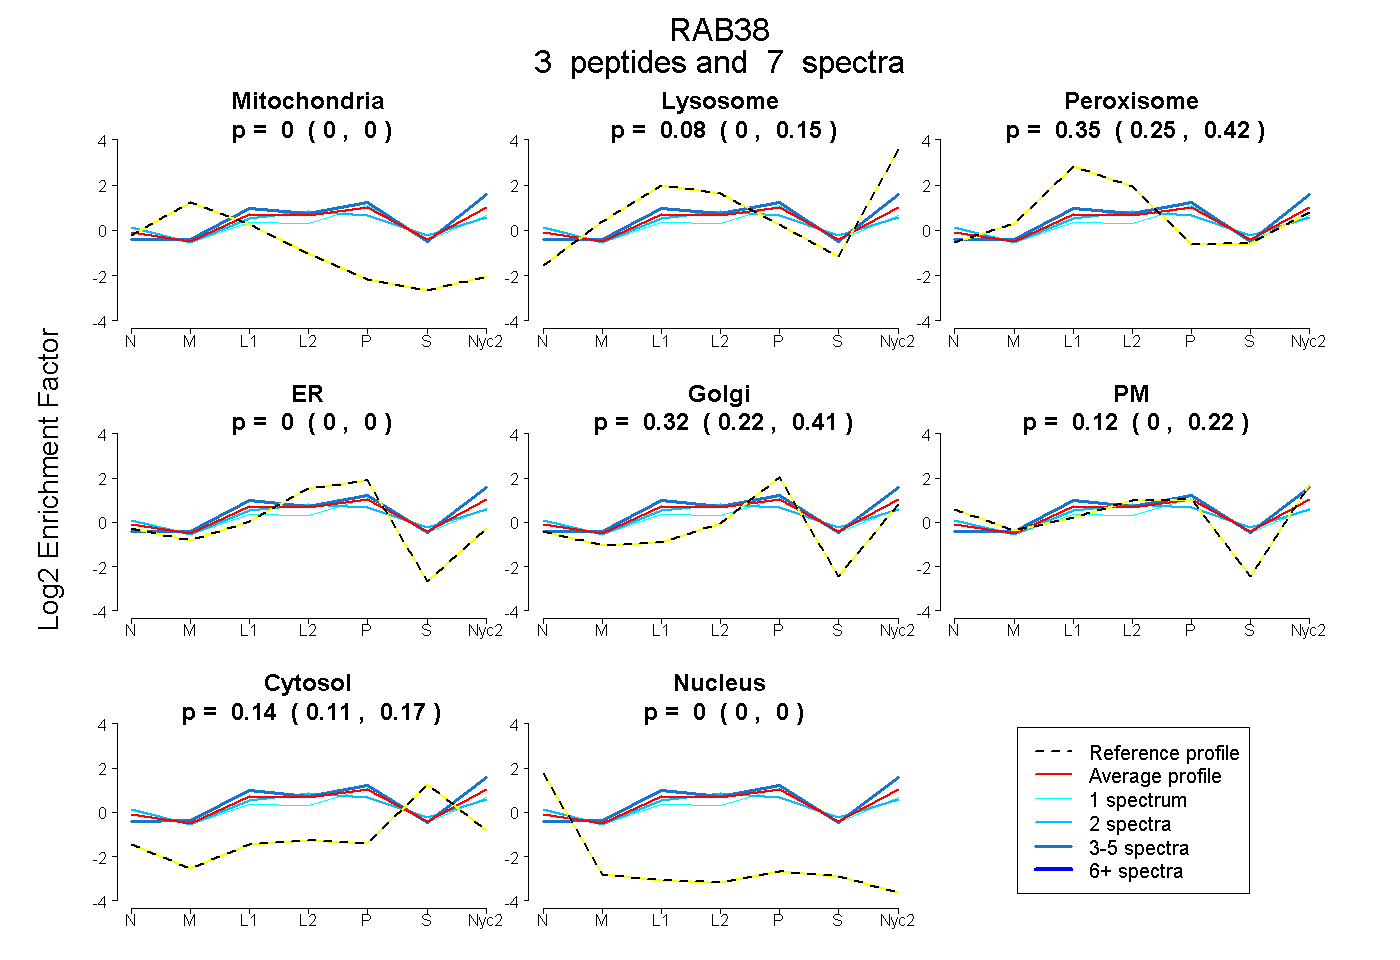
0.000 | 0.000
0.000 | 0.149
0.248 | 0.417
0.000 | 0.000
0.216 | 0.412
0.000 | 0.223
0.107 | 0.166
0.000 | 0.000
| Plot | Mito | Lyso | Perox | ER | Golgi | PM | Cytosol | Nucleus | |||||
| Expt A |
3 peptides |
7 spectra |
|
0.000 0.000 | 0.000 |
0.076 0.000 | 0.149 |
0.345 0.248 | 0.417 |
0.000 0.000 | 0.000 |
0.323 0.216 | 0.412 |
0.119 0.000 | 0.223 |
0.137 0.107 | 0.166 |
0.000 0.000 | 0.000 |
| 2 spectra, ENINIDEASR | 0.000 | 0.000 | 0.335 | 0.059 | 0.085 | 0.292 | 0.229 | 0.000 | ||
| 1 spectrum, EHGFVGWFETSAK | 0.000 | 0.000 | 0.295 | 0.000 | 0.367 | 0.160 | 0.179 | 0.000 | ||
| 4 spectra, VLHWDPETVVR | 0.000 | 0.280 | 0.264 | 0.000 | 0.372 | 0.000 | 0.084 | 0.000 |
| Plot | Mito | Lyso or Perox | ER | Golgi | PM | Cytosol | Nucleus | ||||||
| Expt B |
2 peptides |
2 spectra |
 |
0.000 NA | NA |
0.454 NA | NA |
0.000 NA | NA |
0.000 NA | NA |
0.477 NA | NA |
0.069 NA | NA |
0.000 NA | NA |
|||
| Plot | Lyso | Other | |||||||||||
| Expt C |
4 peptides |
15 spectra |
 |
0.031 0.000 | 0.626 |
0.969 0.366 | 1.000 |
||||||||
| Plot | Lyso | Other | |||||||||||
| Expt D |
1 peptide |
1 spectrum |
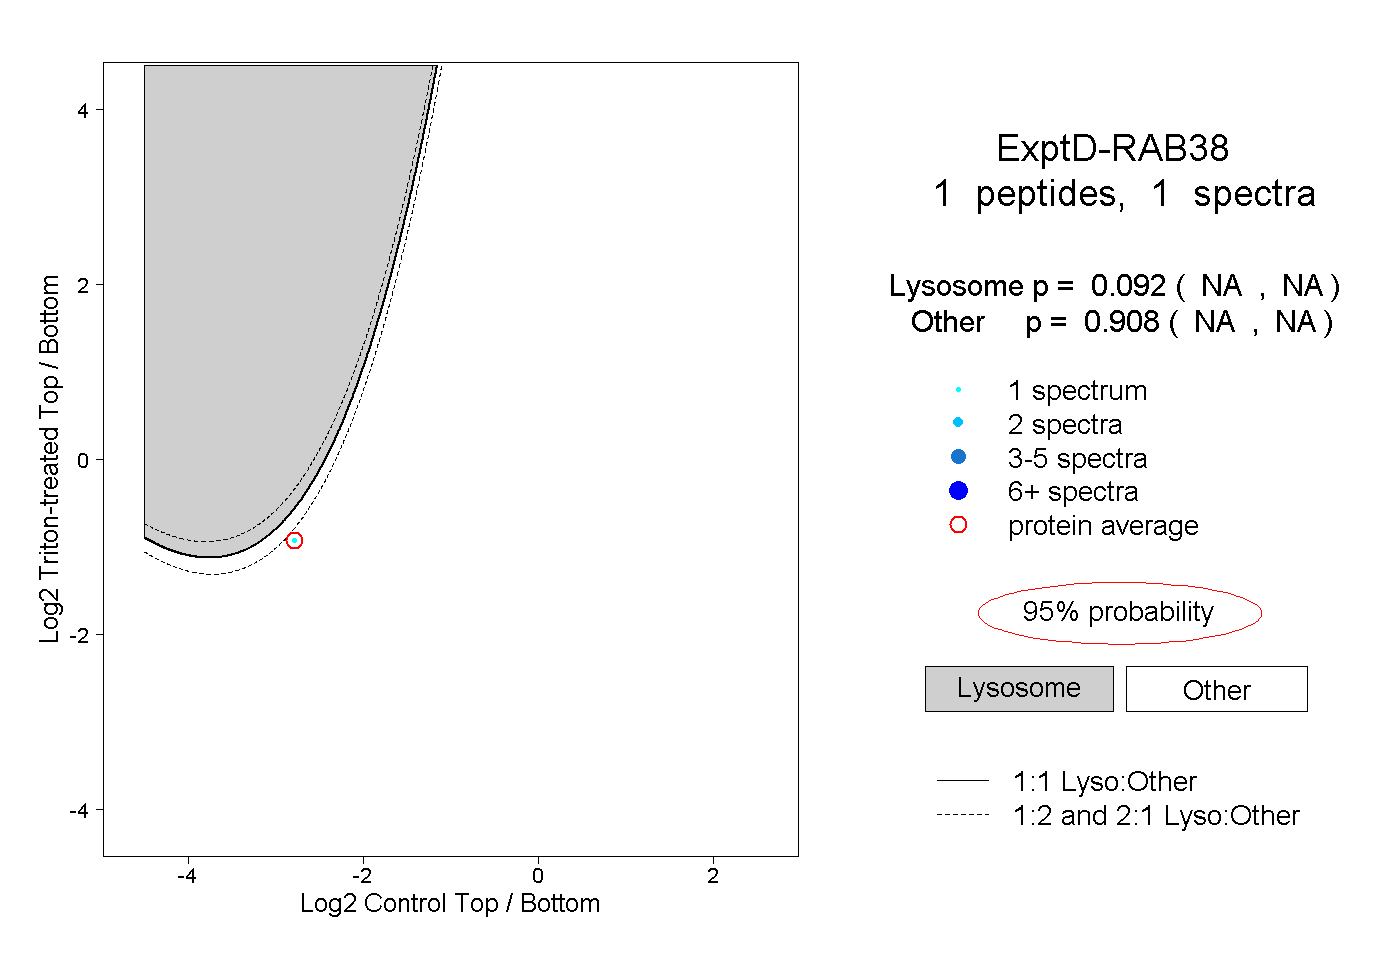 |
0.092 NA | NA |
0.908 NA | NA |