 4
4peptides
spectra
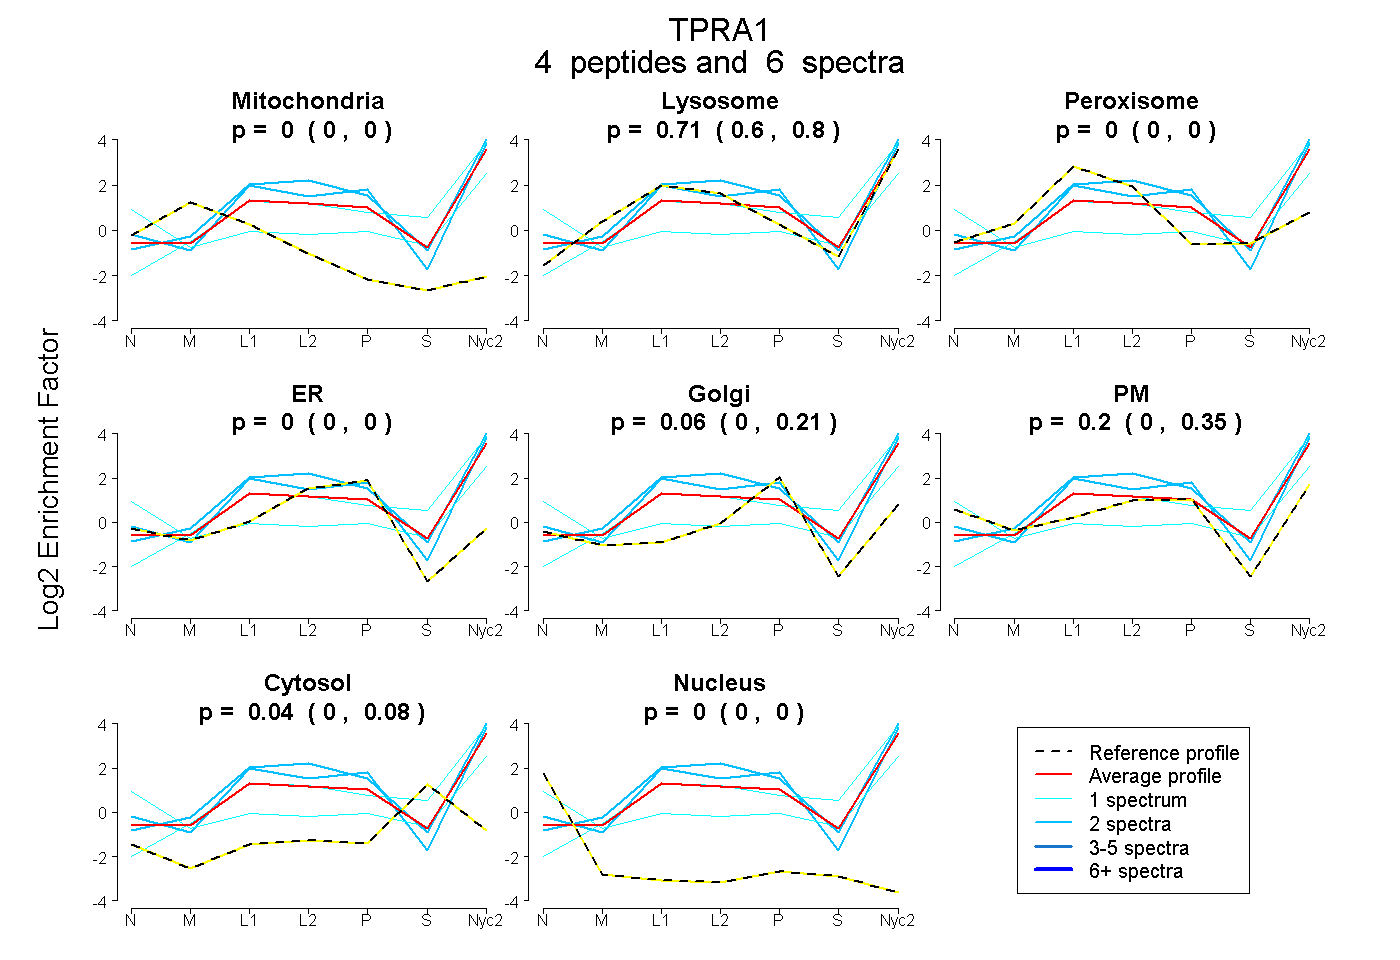
0.000 | 0.000
0.600 | 0.800
0.000 | 0.000
0.000 | 0.000
0.000 | 0.210
0.000 | 0.353
0.000 | 0.080
0.000 | 0.000
1peptide
spectrum
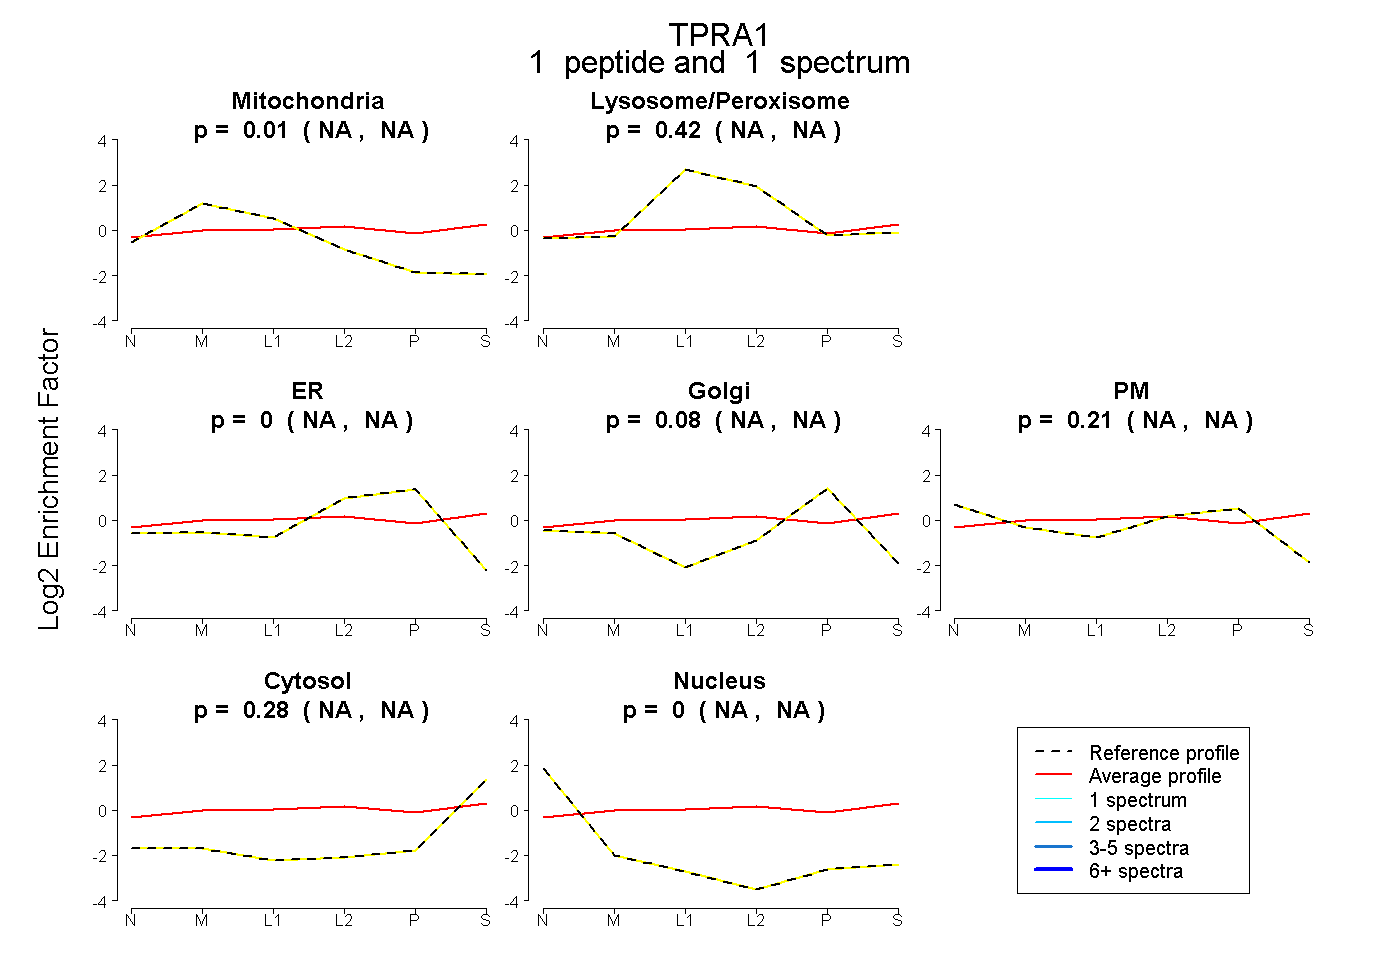
NA | NA
NA | NA
NA | NA
NA | NA
NA | NA
NA | NA
NA | NA
2peptides
spectra
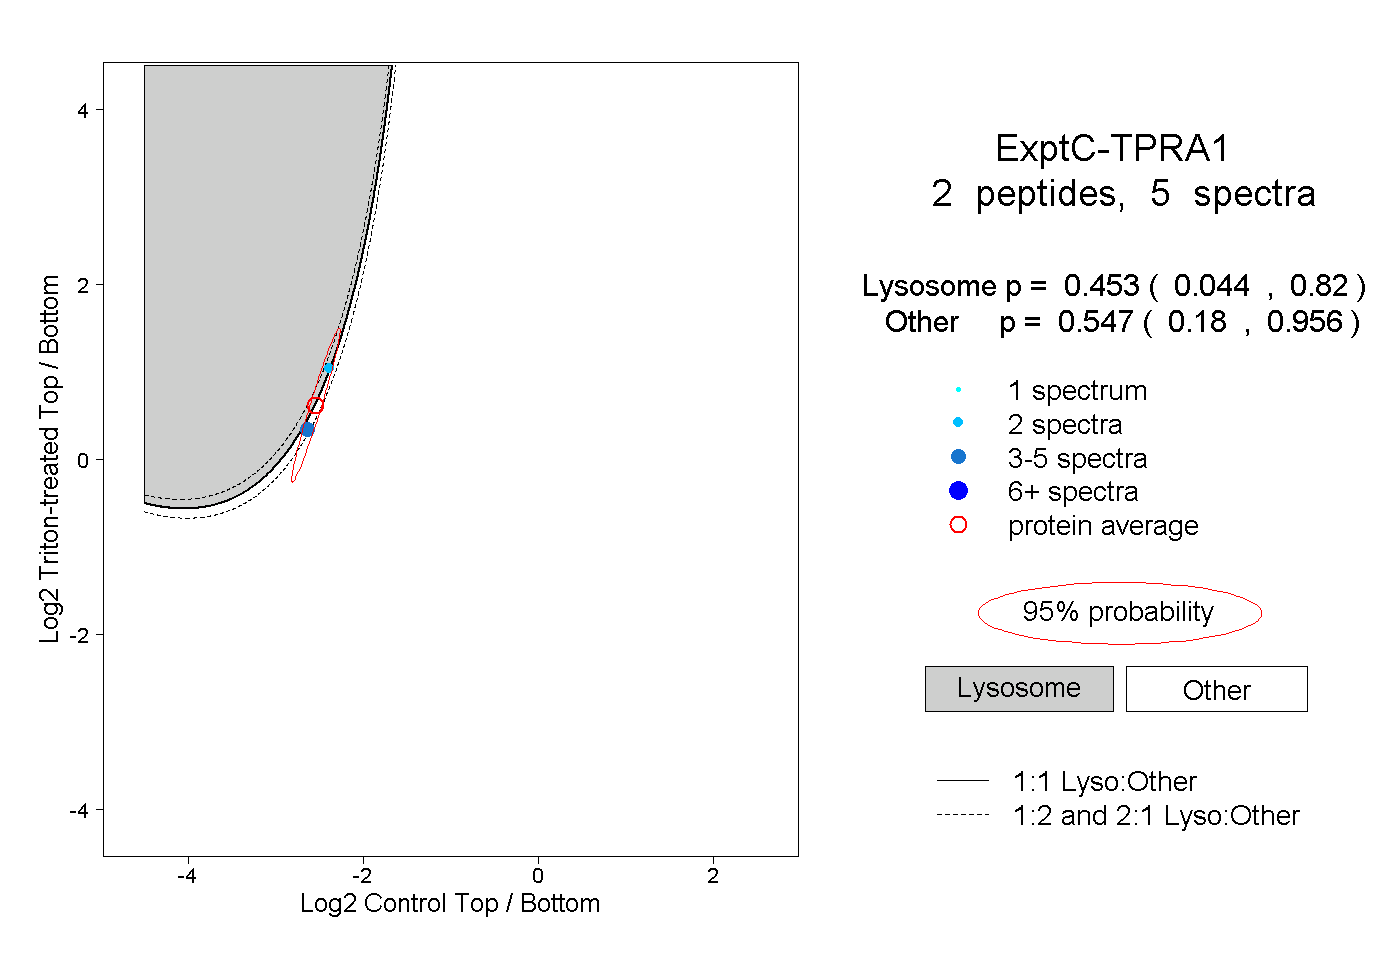
0.044 | 0.820
0.180 | 0.956