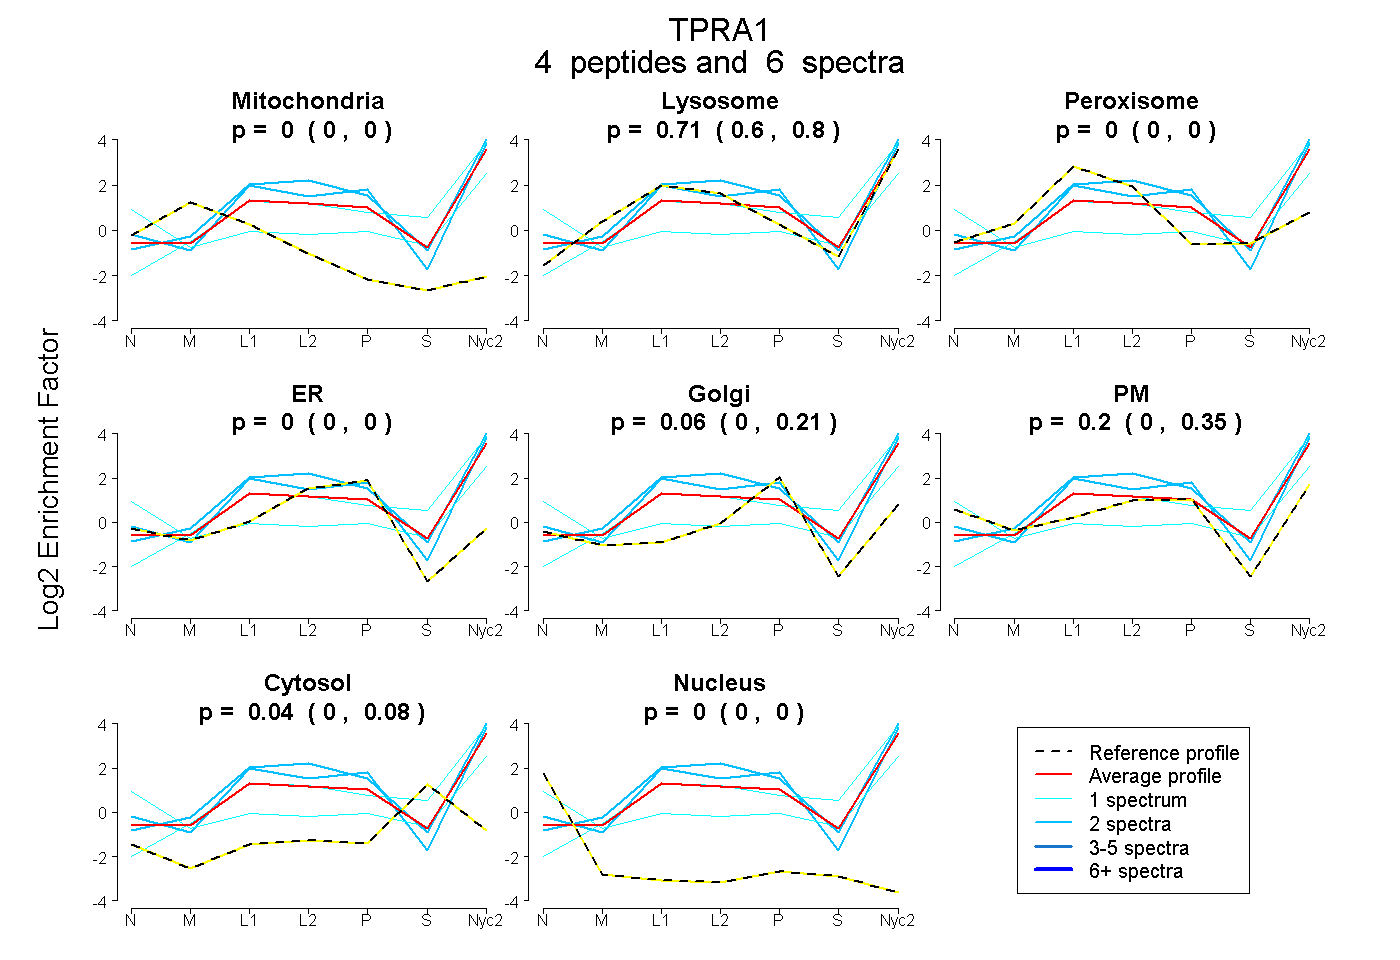
 4
4peptides
spectra
0.000 | 0.000
0.600 | 0.800
0.000 | 0.000
0.000 | 0.000
0.000 | 0.210
0.000 | 0.353
0.000 | 0.080
0.000 | 0.000
| Plot | Mito | Lyso | Perox | ER | Golgi | PM | Cytosol | Nucleus | |||||
| Expt A |
4 peptides |
6 spectra |
|
0.000 0.000 | 0.000 |
0.708 0.600 | 0.800 |
0.000 0.000 | 0.000 |
0.000 0.000 | 0.000 |
0.057 0.000 | 0.210 |
0.199 0.000 | 0.353 |
0.036 0.000 | 0.080 |
0.000 0.000 | 0.000 |
| 1 spectrum, ILWEITR | 0.000 | 0.165 | 0.000 | 0.000 | 0.000 | 0.590 | 0.245 | 0.000 | ||
| 2 spectra, GFFGSEPK | 0.000 | 0.907 | 0.000 | 0.000 | 0.000 | 0.093 | 0.000 | 0.000 | ||
| 1 spectrum, VSLPSR | 0.000 | 0.860 | 0.000 | 0.000 | 0.000 | 0.000 | 0.140 | 0.000 | ||
| 2 spectra, ILFSYK | 0.000 | 0.628 | 0.000 | 0.000 | 0.000 | 0.372 | 0.000 | 0.000 |
| Plot | Mito | Lyso or Perox | ER | Golgi | PM | Cytosol | Nucleus | ||||||
| Expt B |
1 peptide |
1 spectrum |
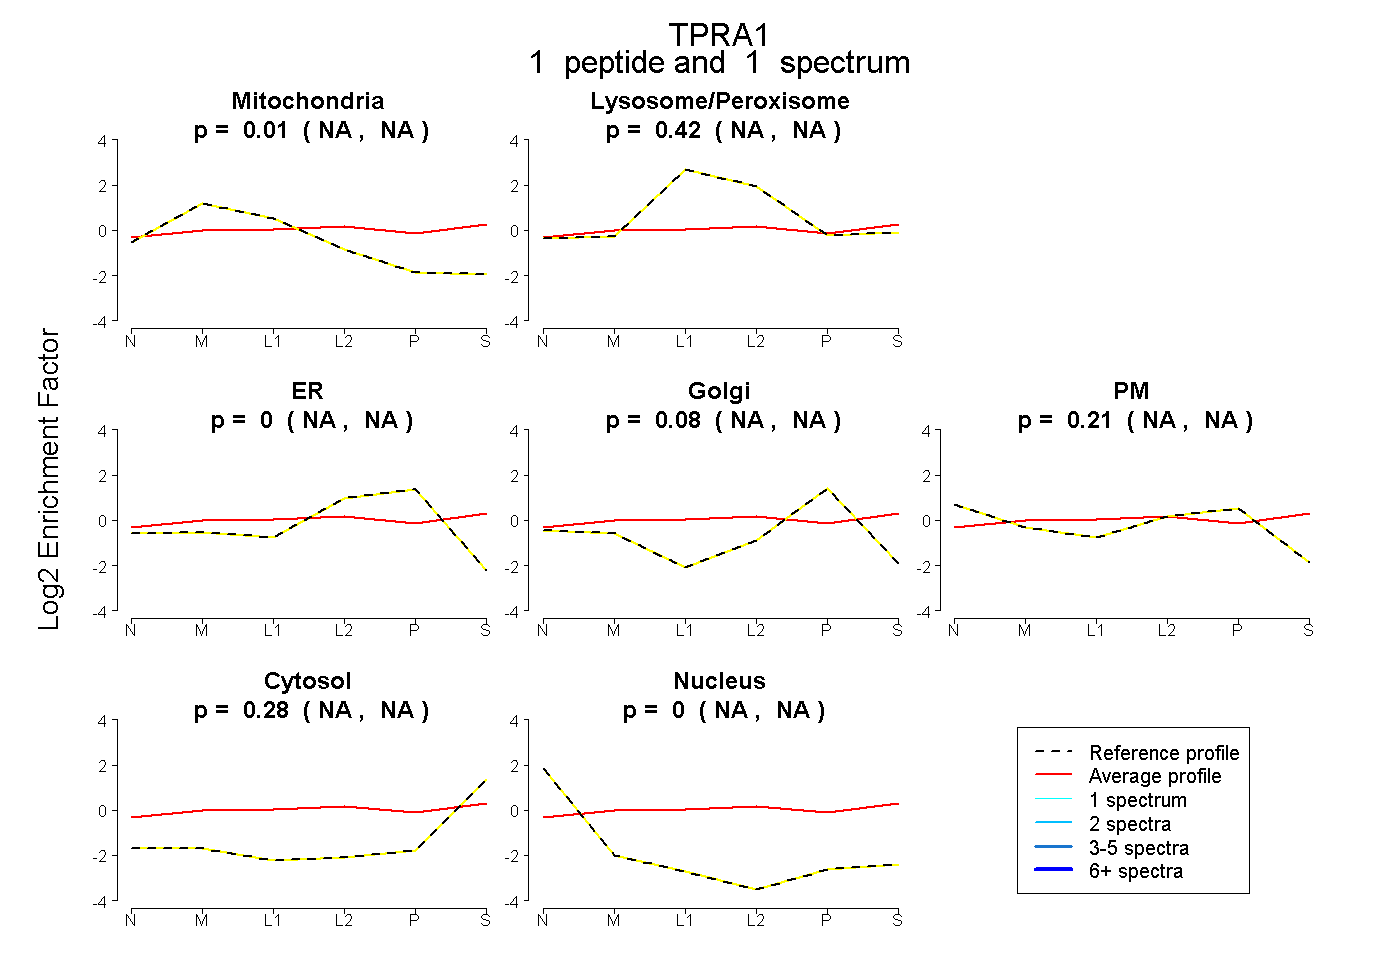 |
0.008 NA | NA |
0.420 NA | NA |
0.000 NA | NA |
0.083 NA | NA |
0.212 NA | NA |
0.277 NA | NA |
0.000 NA | NA |
|||
| Plot | Lyso | Other | |||||||||||
| Expt C |
2 peptides |
5 spectra |
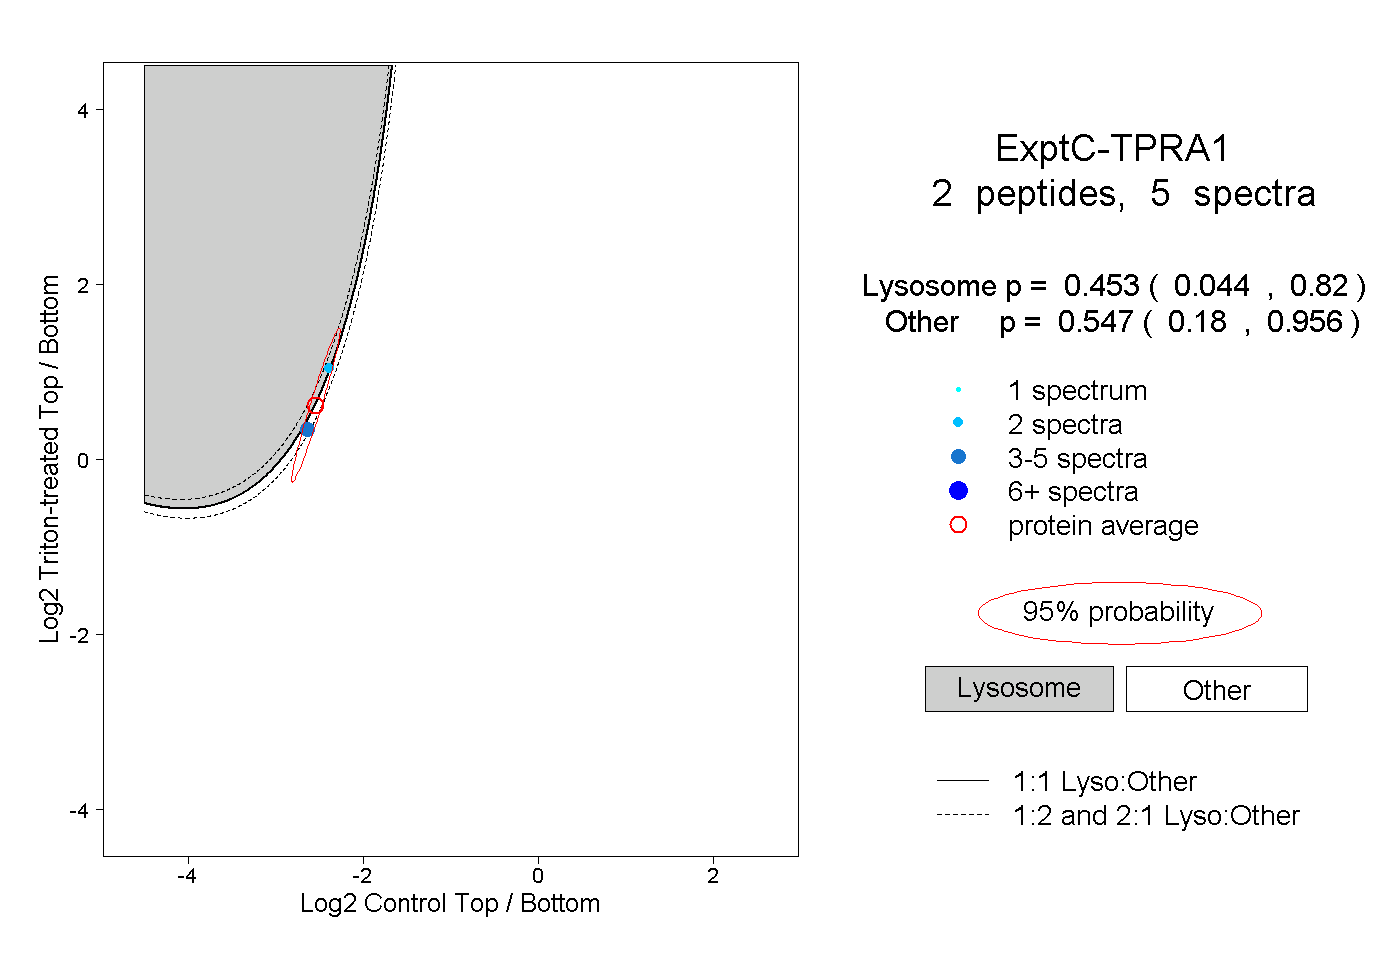 |
0.453 0.044 | 0.820 |
0.547 0.180 | 0.956 |