 5
5peptides
spectra
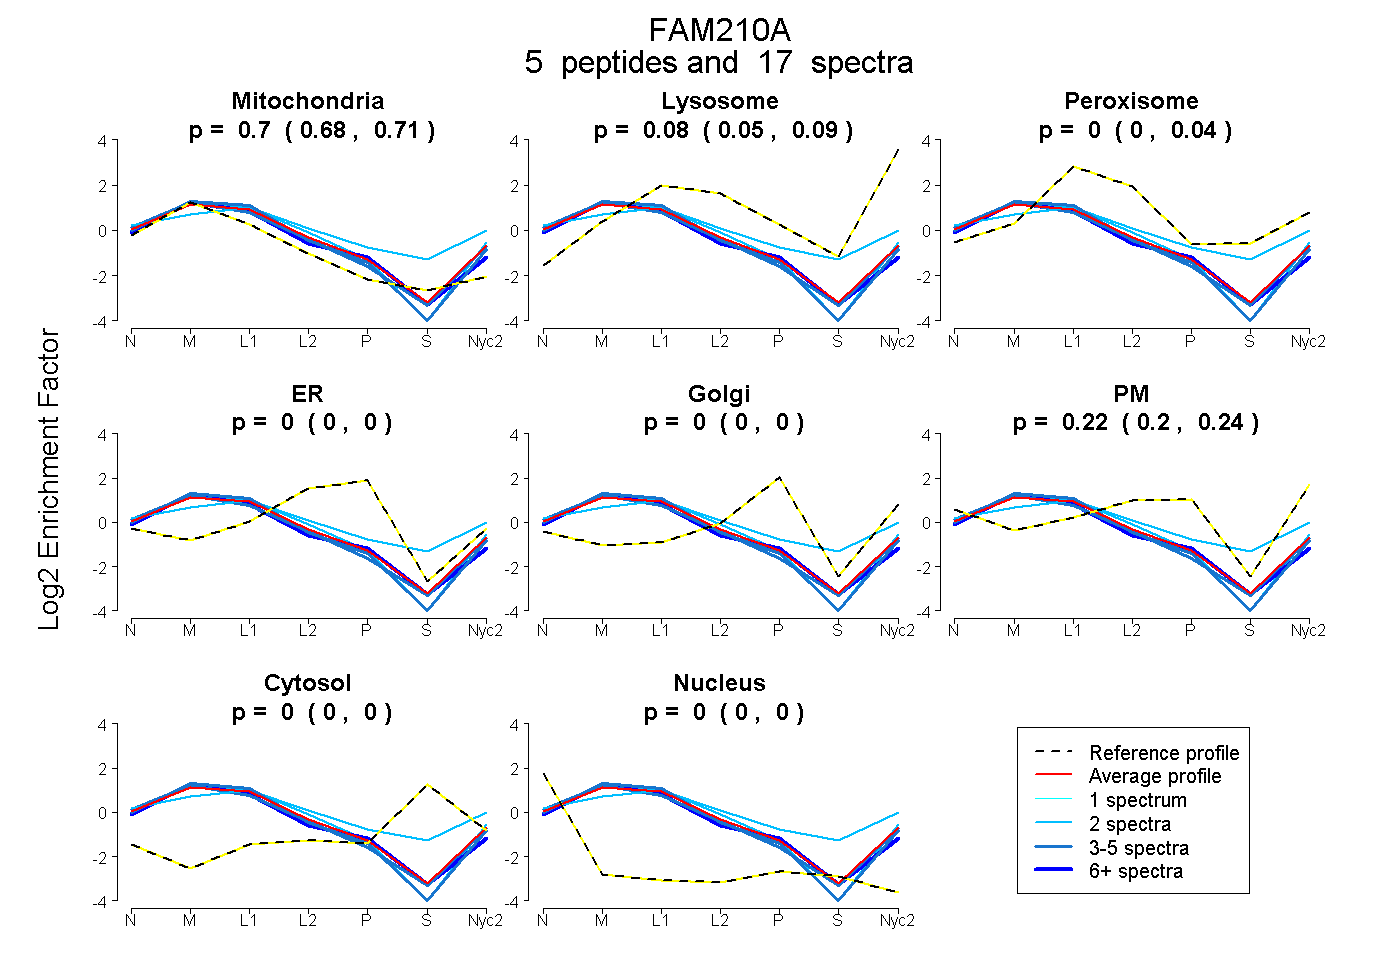
0.682 | 0.708
0.048 | 0.090
0.000 | 0.040
0.000 | 0.000
0.000 | 0.000
0.197 | 0.240
0.000 | 0.000
0.000 | 0.000
2peptides
spectra
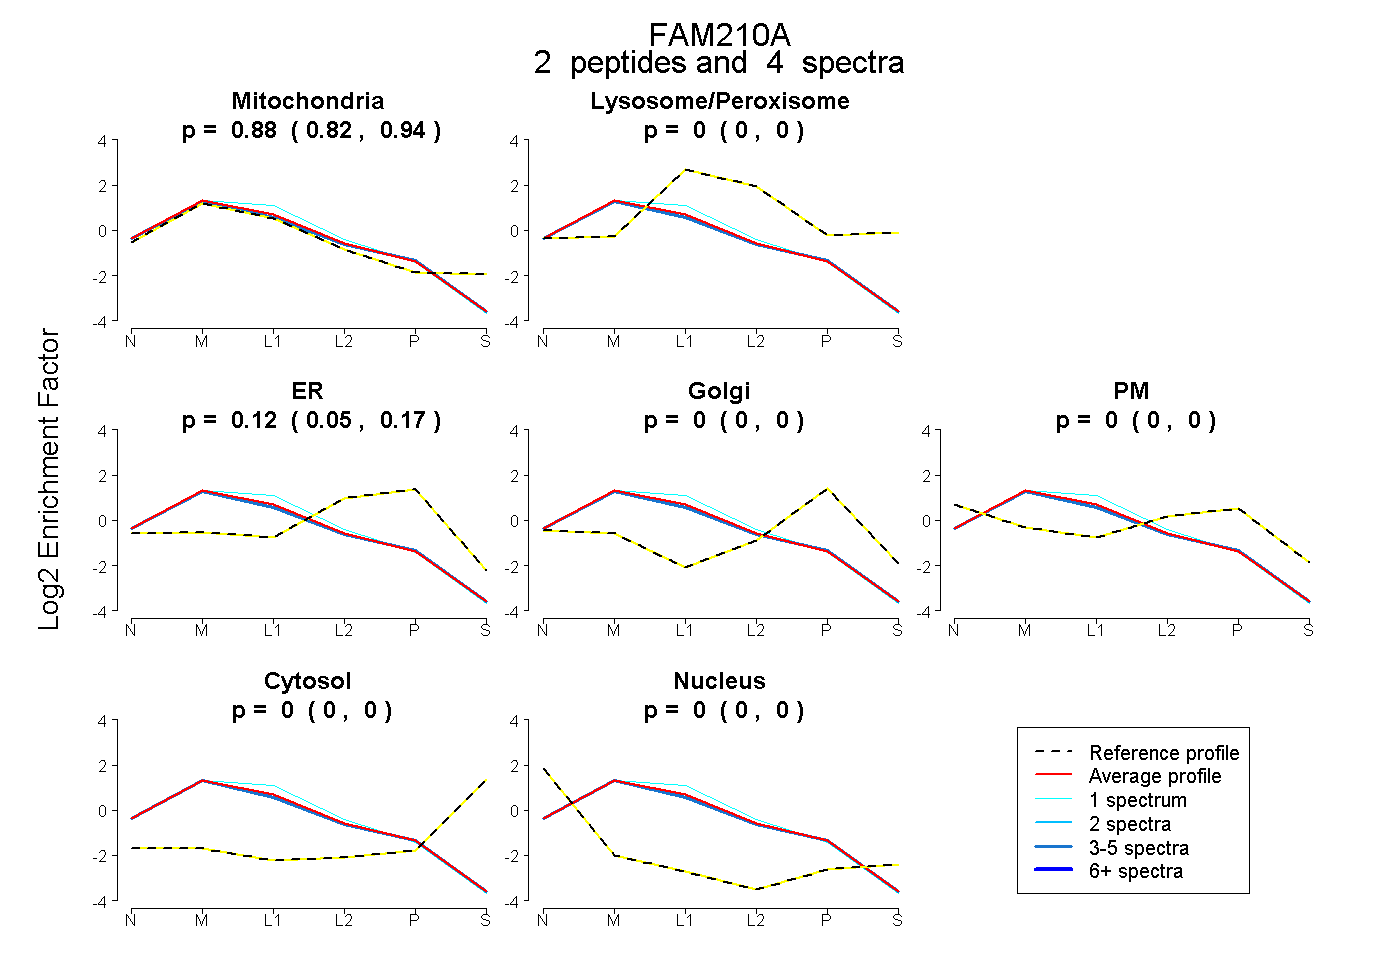
0.819 | 0.935
0.000 | 0.000
0.052 | 0.169
0.000 | 0.000
0.000 | 0.000
0.000 | 0.000
0.000 | 0.000
7peptides
spectra
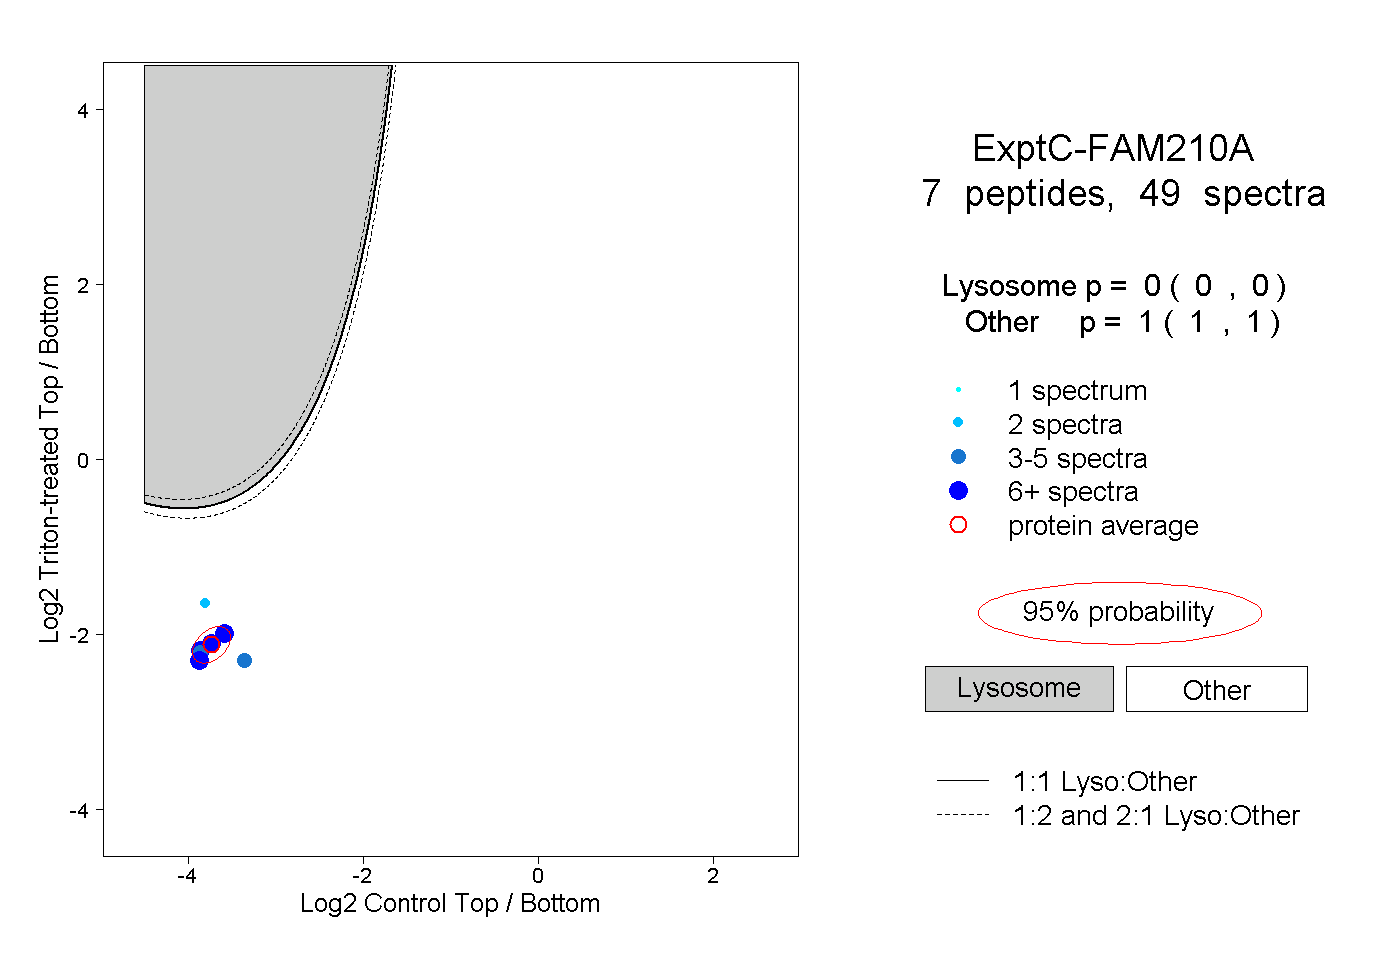
0.000 | 0.000
1.000 | 1.000
3peptides
spectra
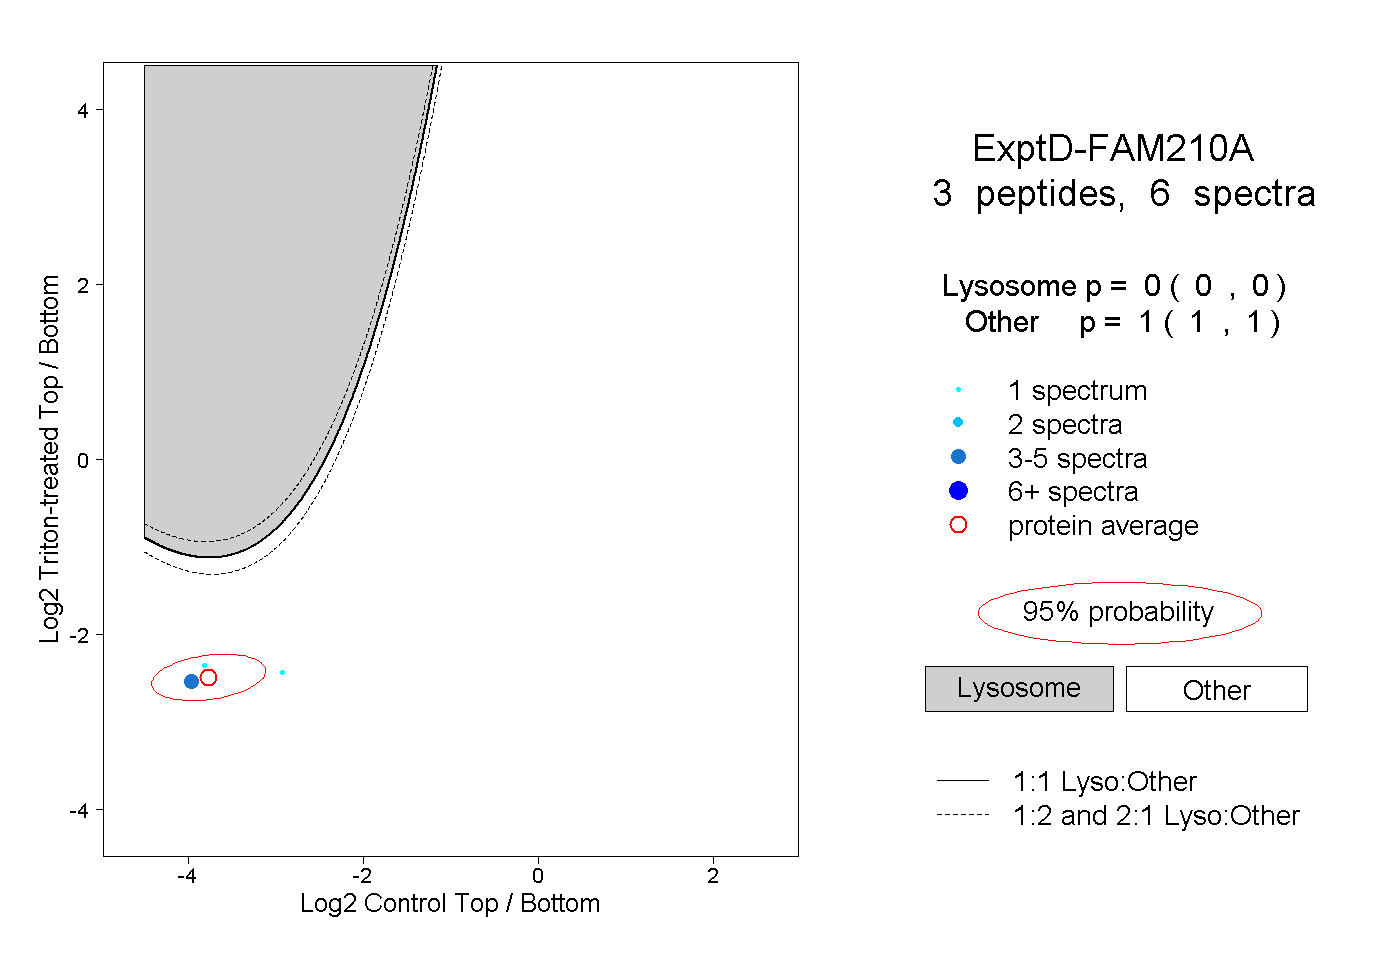
0.000 | 0.000
1.000 | 1.000