 5
5peptides
spectra
0.682 | 0.708
0.048 | 0.090
0.000 | 0.040
0.000 | 0.000
0.000 | 0.000
0.197 | 0.240
0.000 | 0.000
0.000 | 0.000
| Plot | Mito | Lyso | Perox | ER | Golgi | PM | Cytosol | Nucleus | |||||
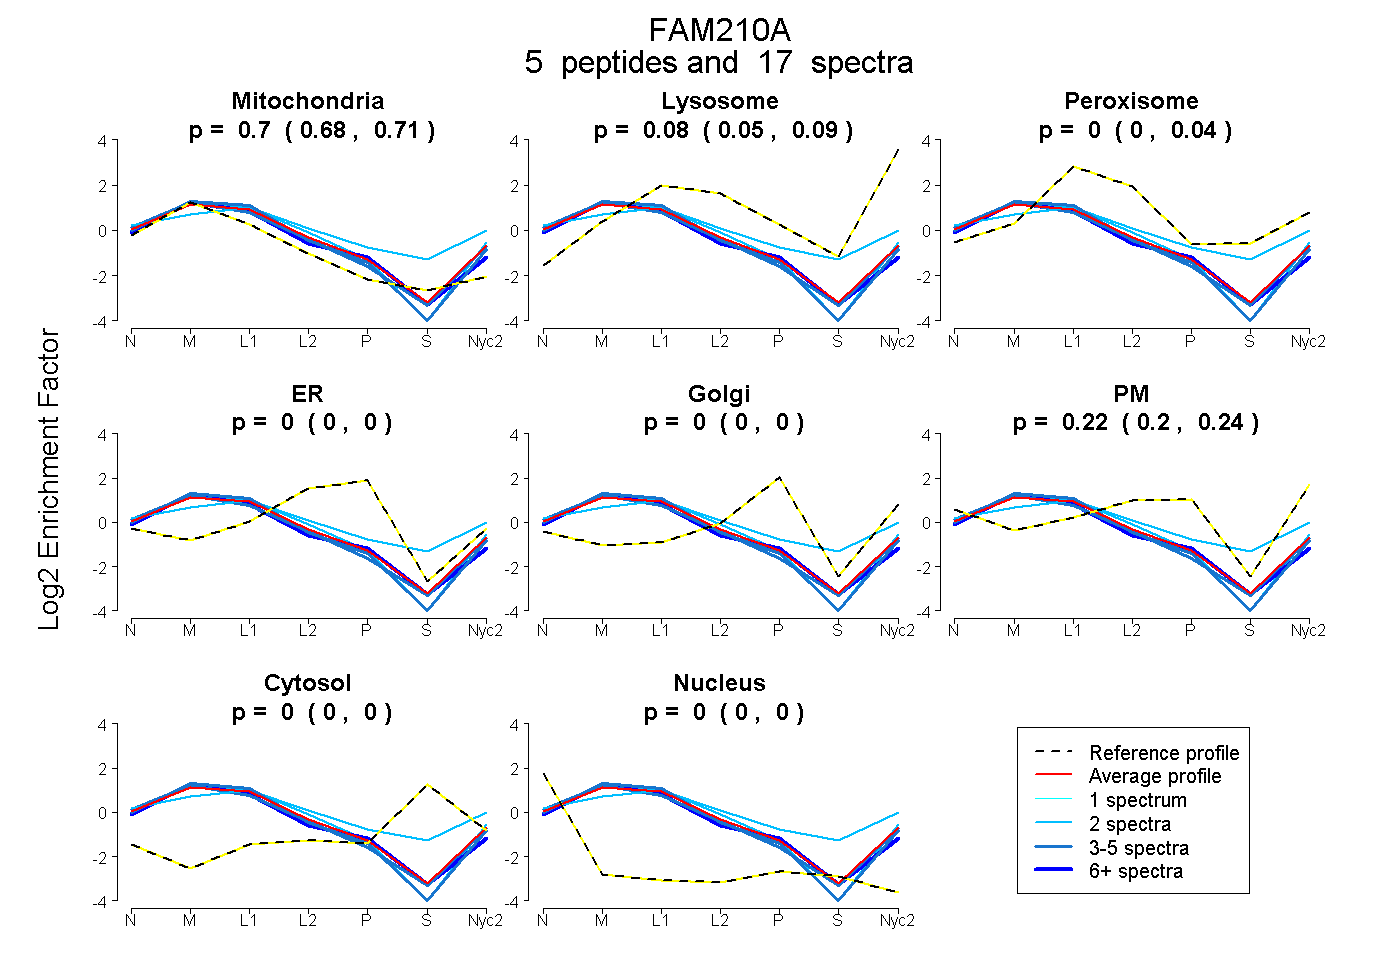
| Expt A |
5 peptides |
17 spectra |
|
0.699 0.682 | 0.708 |
0.076 0.048 | 0.090 |
0.005 0.000 | 0.040 |
0.000 0.000 | 0.000 |
0.000 0.000 | 0.000 |
0.219 0.197 | 0.240 |
0.000 0.000 | 0.000 |
0.000 0.000 | 0.000 |
| 2 spectra, SHGYMSTPPPVK | 0.377 | 0.000 | 0.327 | 0.000 | 0.000 | 0.237 | 0.060 | 0.000 | ||
| 3 spectra, IATPAR | 0.748 | 0.063 | 0.000 | 0.000 | 0.000 | 0.188 | 0.000 | 0.000 | ||
| 4 spectra, SISLYQR | 0.753 | 0.036 | 0.000 | 0.000 | 0.000 | 0.211 | 0.000 | 0.000 | ||
| 6 spectra, EYLQGR | 0.773 | 0.026 | 0.000 | 0.039 | 0.000 | 0.162 | 0.000 | 0.000 | ||
| 2 spectra, EEPDPLQDK | 0.676 | 0.035 | 0.000 | 0.000 | 0.000 | 0.289 | 0.000 | 0.000 |
| Plot | Mito | Lyso or Perox | ER | Golgi | PM | Cytosol | Nucleus | ||||||
| Expt B |
2 peptides |
4 spectra |
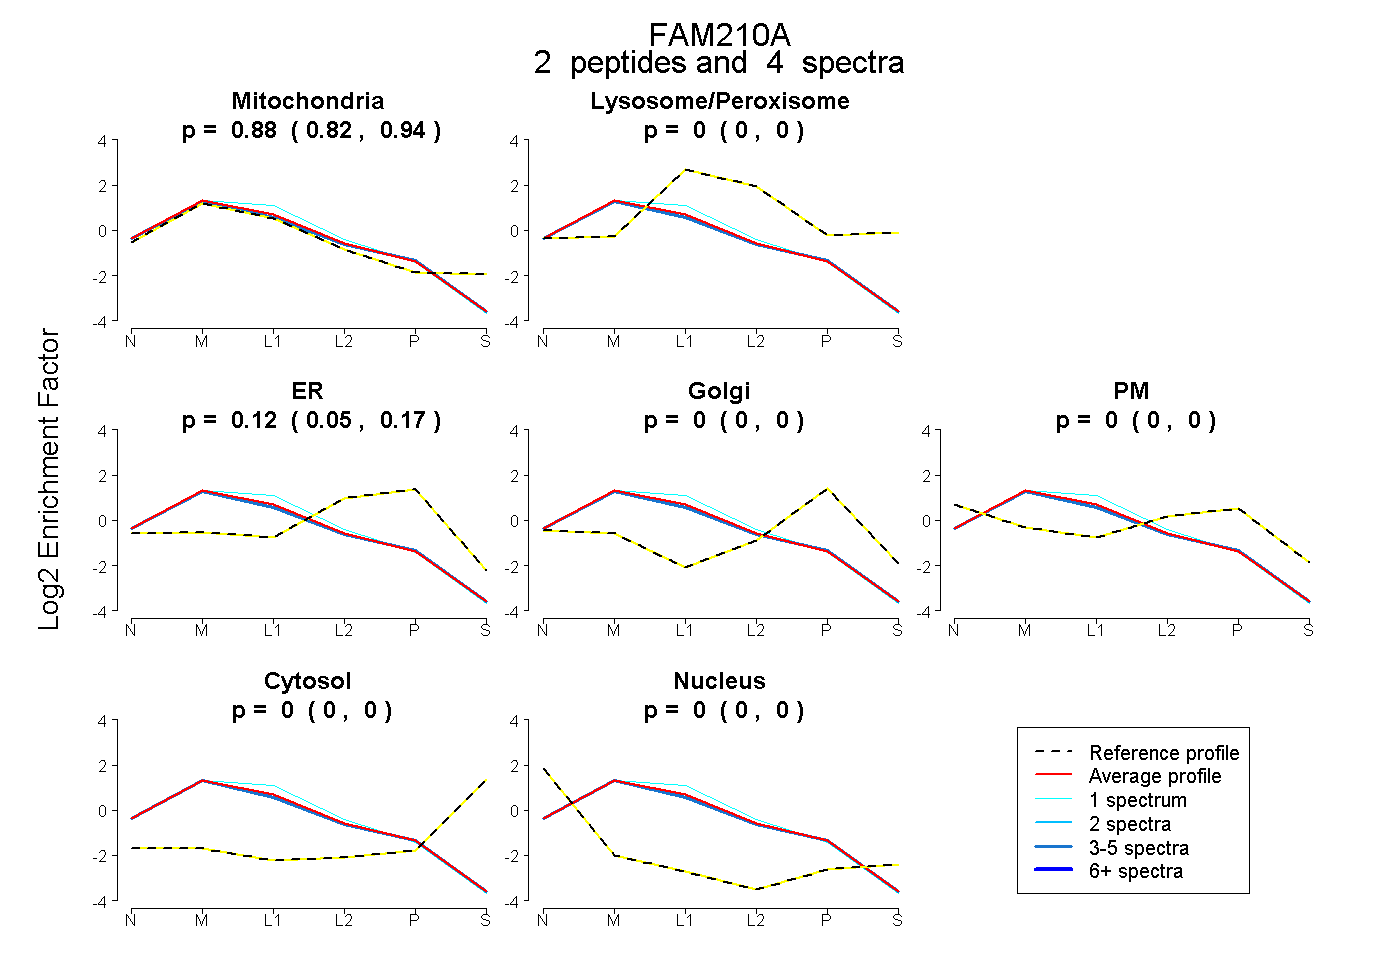 |
0.883 0.819 | 0.935 |
0.000 0.000 | 0.000 |
0.117 0.052 | 0.169 |
0.000 0.000 | 0.000 |
0.000 0.000 | 0.000 |
0.000 0.000 | 0.000 |
0.000 0.000 | 0.000 |
|||
| Plot | Lyso | Other | |||||||||||
| Expt C |
7 peptides |
49 spectra |
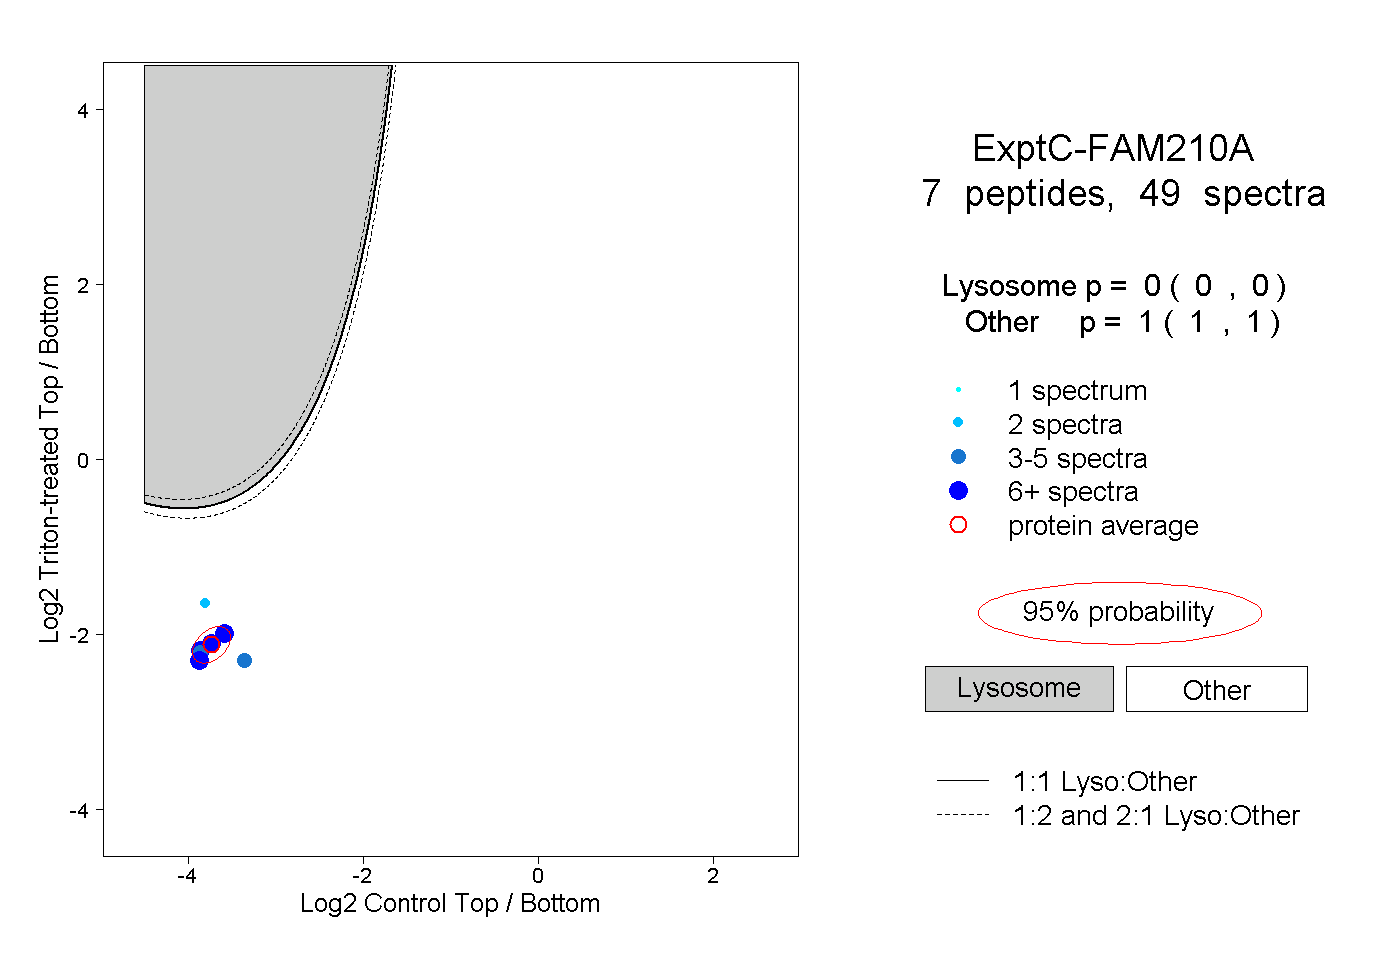 |
0.000 0.000 | 0.000 |
1.000 1.000 | 1.000 |
||||||||
| Plot | Lyso | Other | |||||||||||
| Expt D |
3 peptides |
6 spectra |
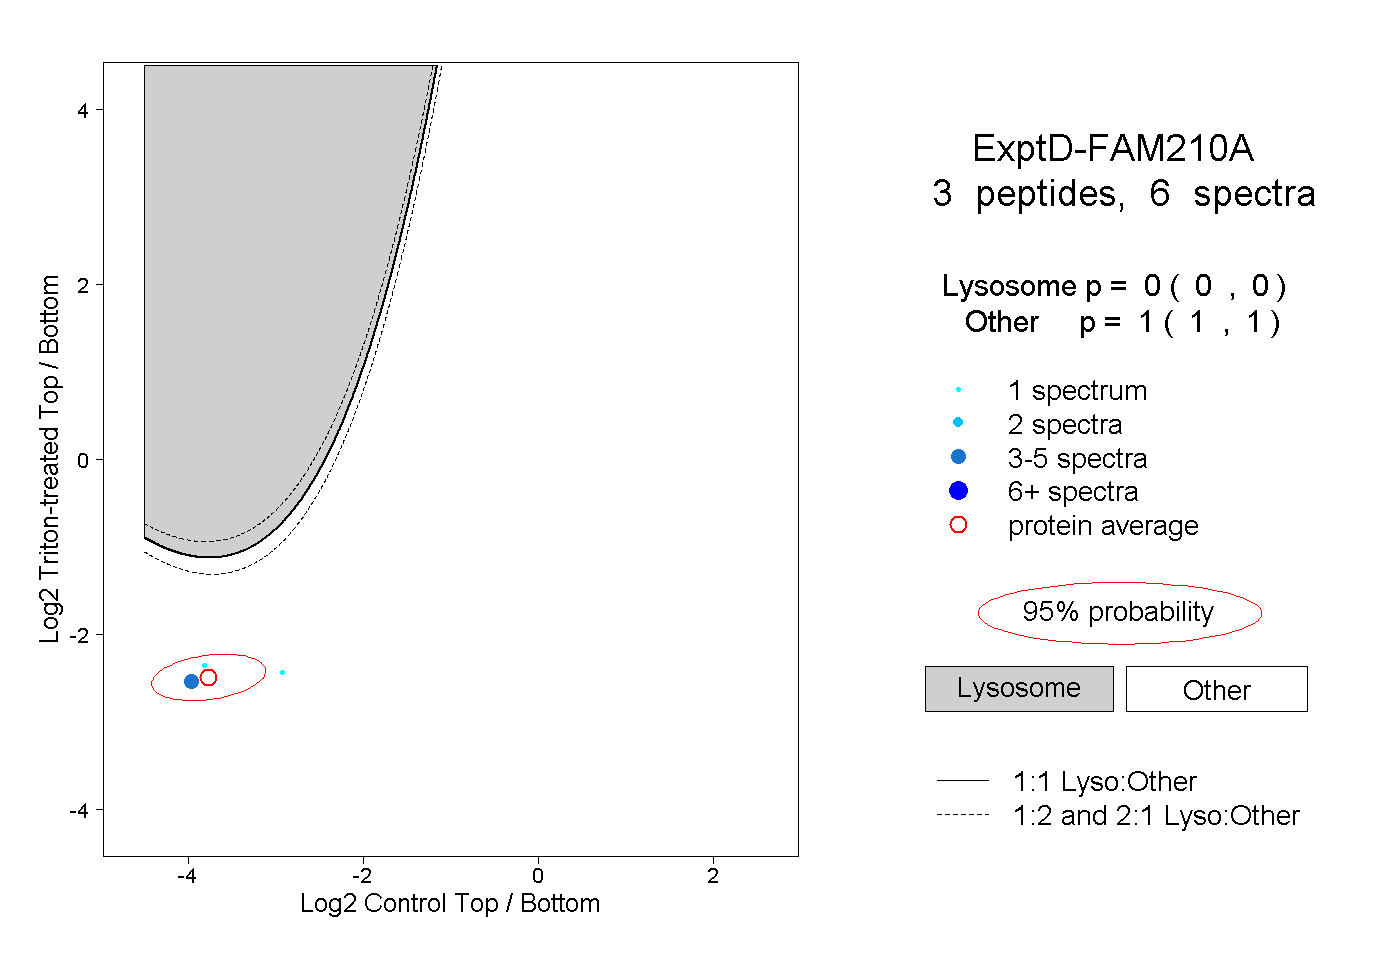 |
0.000 0.000 | 0.000 |
1.000 1.000 | 1.000 |