 4
4peptides
spectra
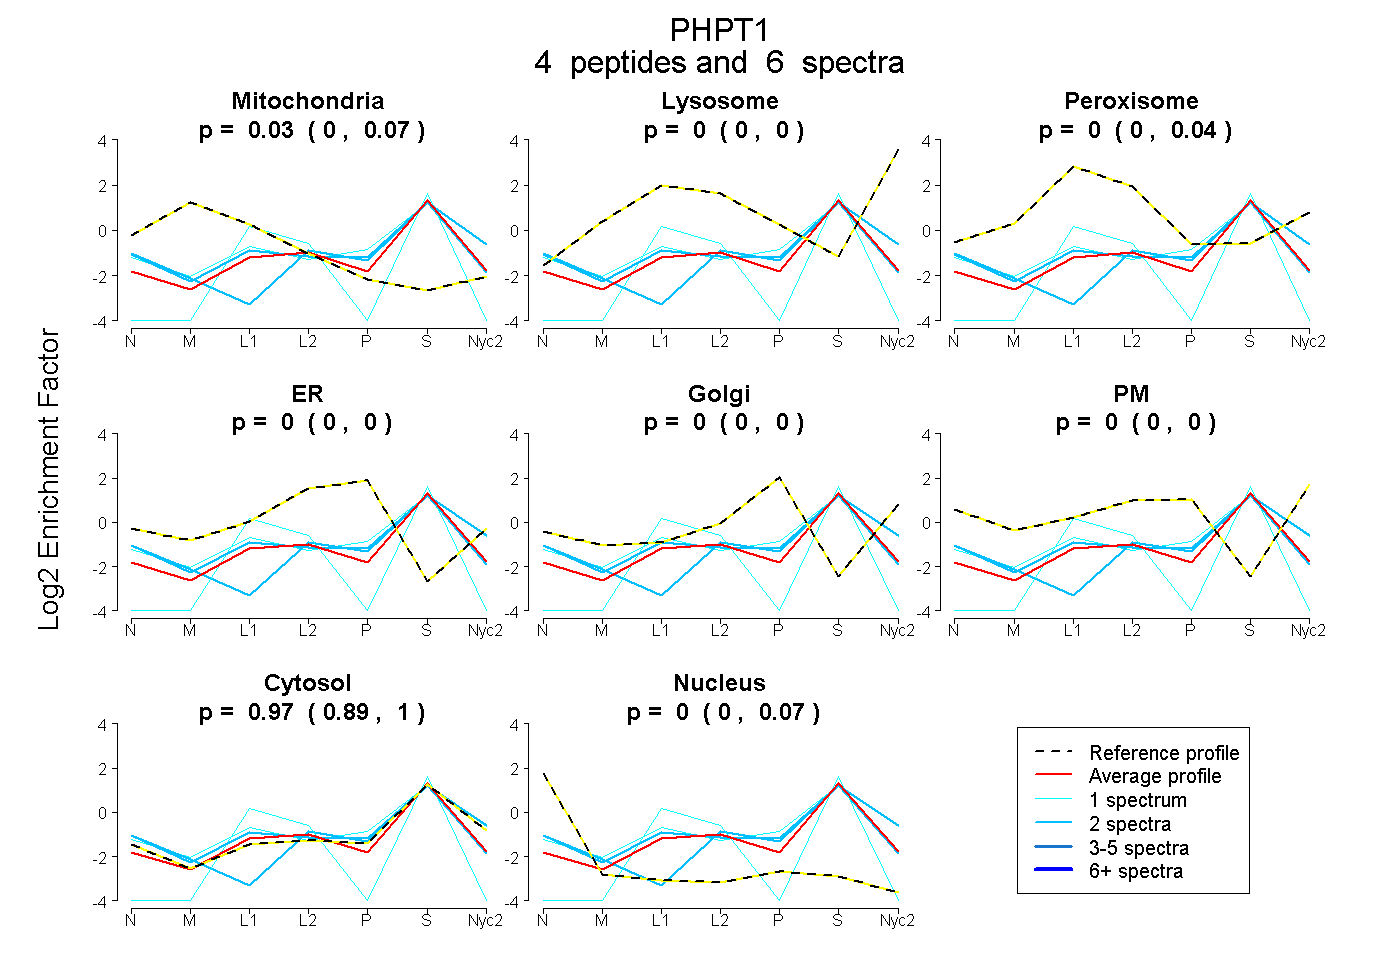
0.000 | 0.066
0.000 | 0.000
0.000 | 0.035
0.000 | 0.000
0.000 | 0.000
0.000 | 0.000
0.894 | 1.000
0.000 | 0.071
3peptides
spectra
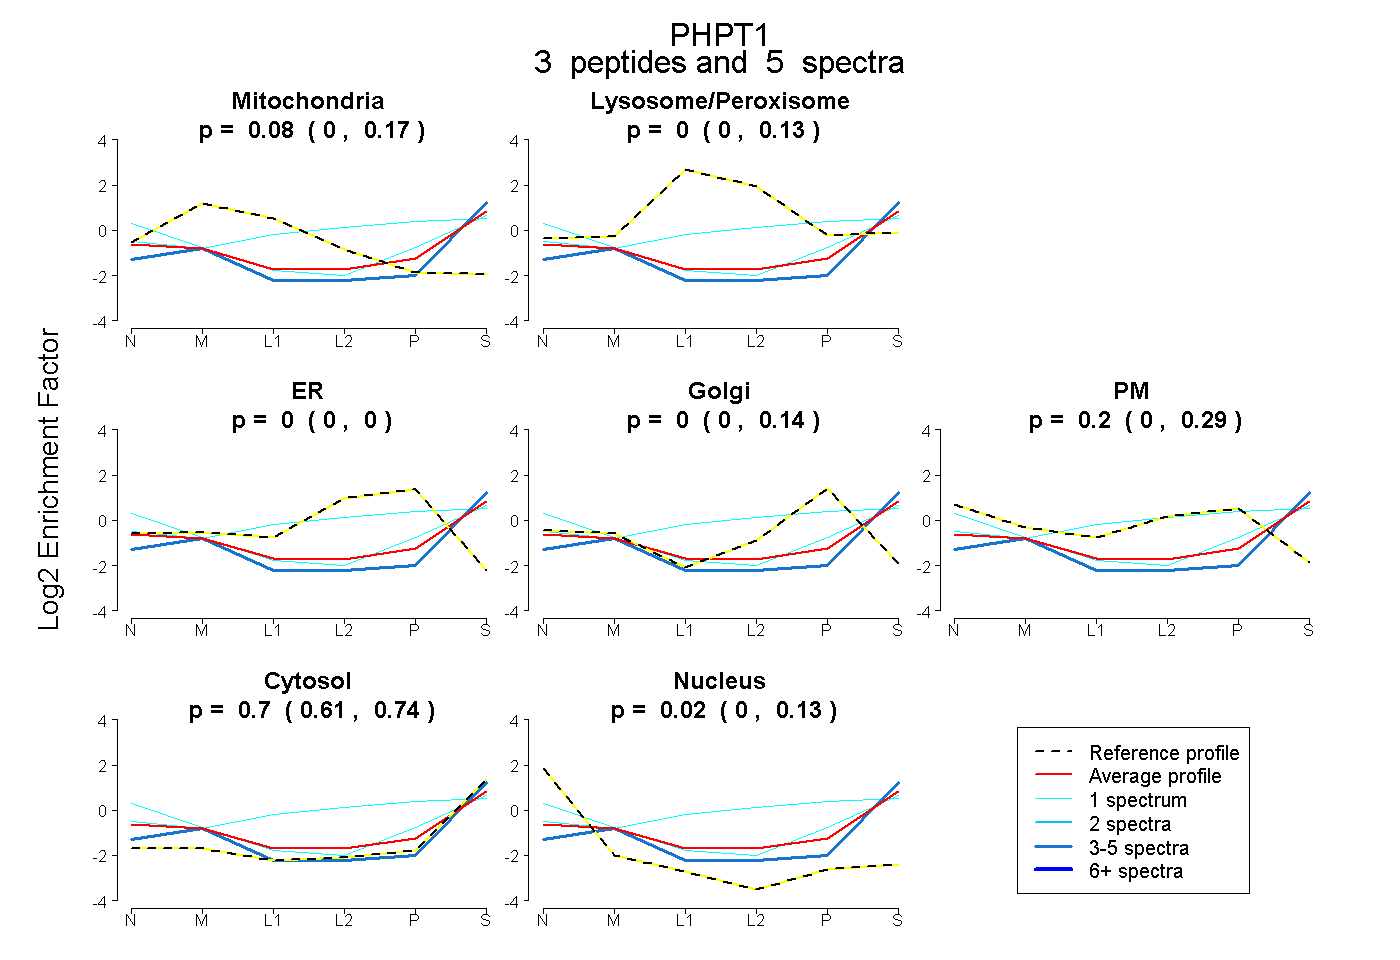
0.000 | 0.166
0.000 | 0.132
0.000 | 0.000
0.000 | 0.136
0.000 | 0.286
0.607 | 0.741
0.000 | 0.127
5peptides
spectra
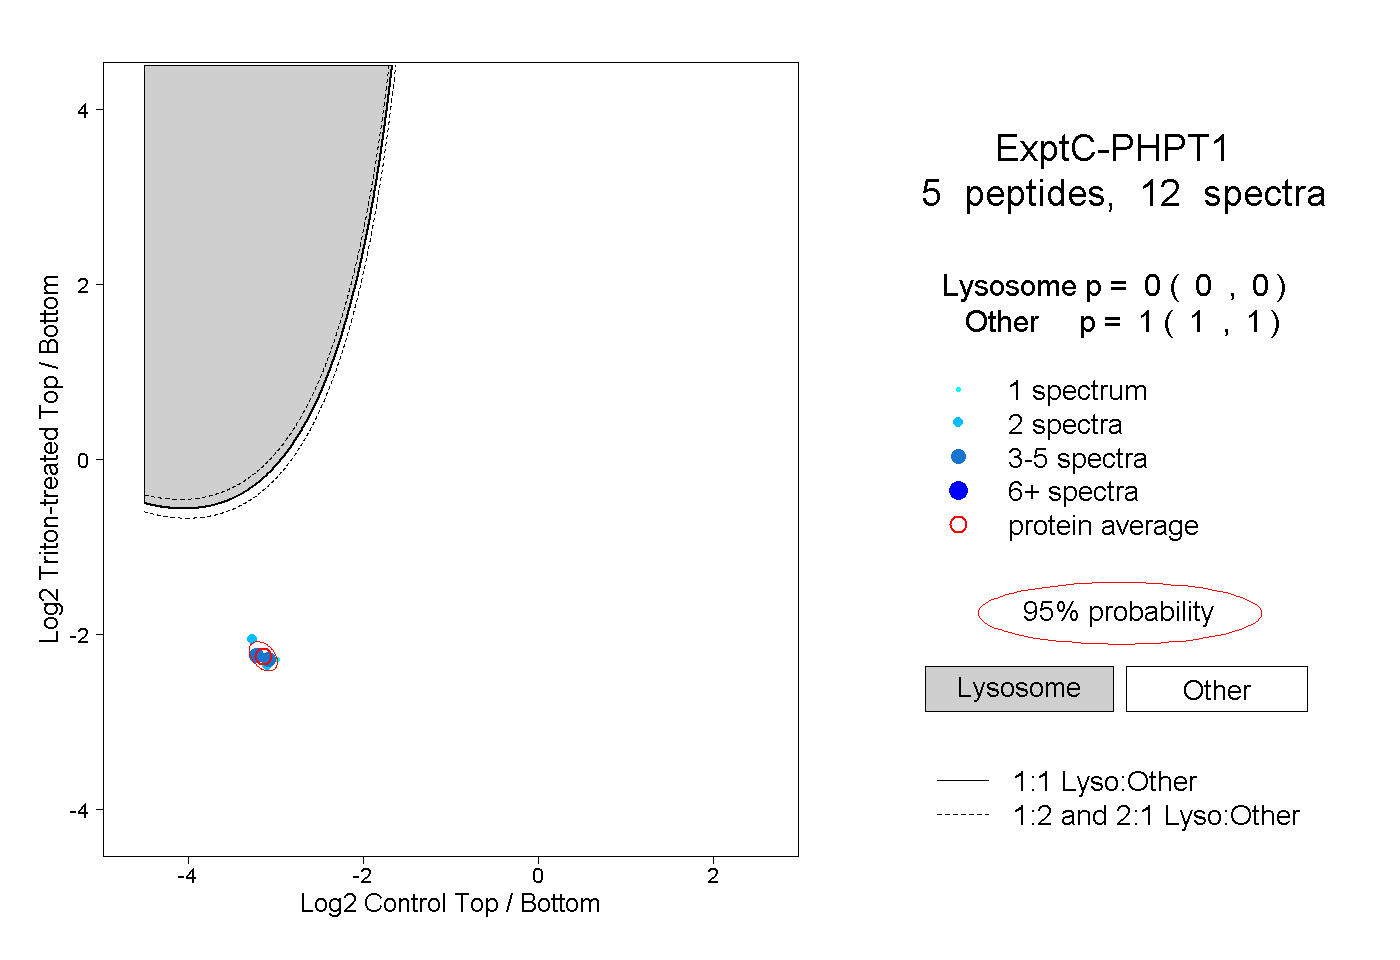
0.000 | 0.000
1.000 | 1.000