PHPT1
[ENSRNOP00000022495]
Main page
| | | Plot |
Mito |
Lyso |
|
Perox |
ER |
Golgi |
PM |
Cytosol |
Nucleus |
|
| Expt A |
 4
4
peptides |
6
spectra |
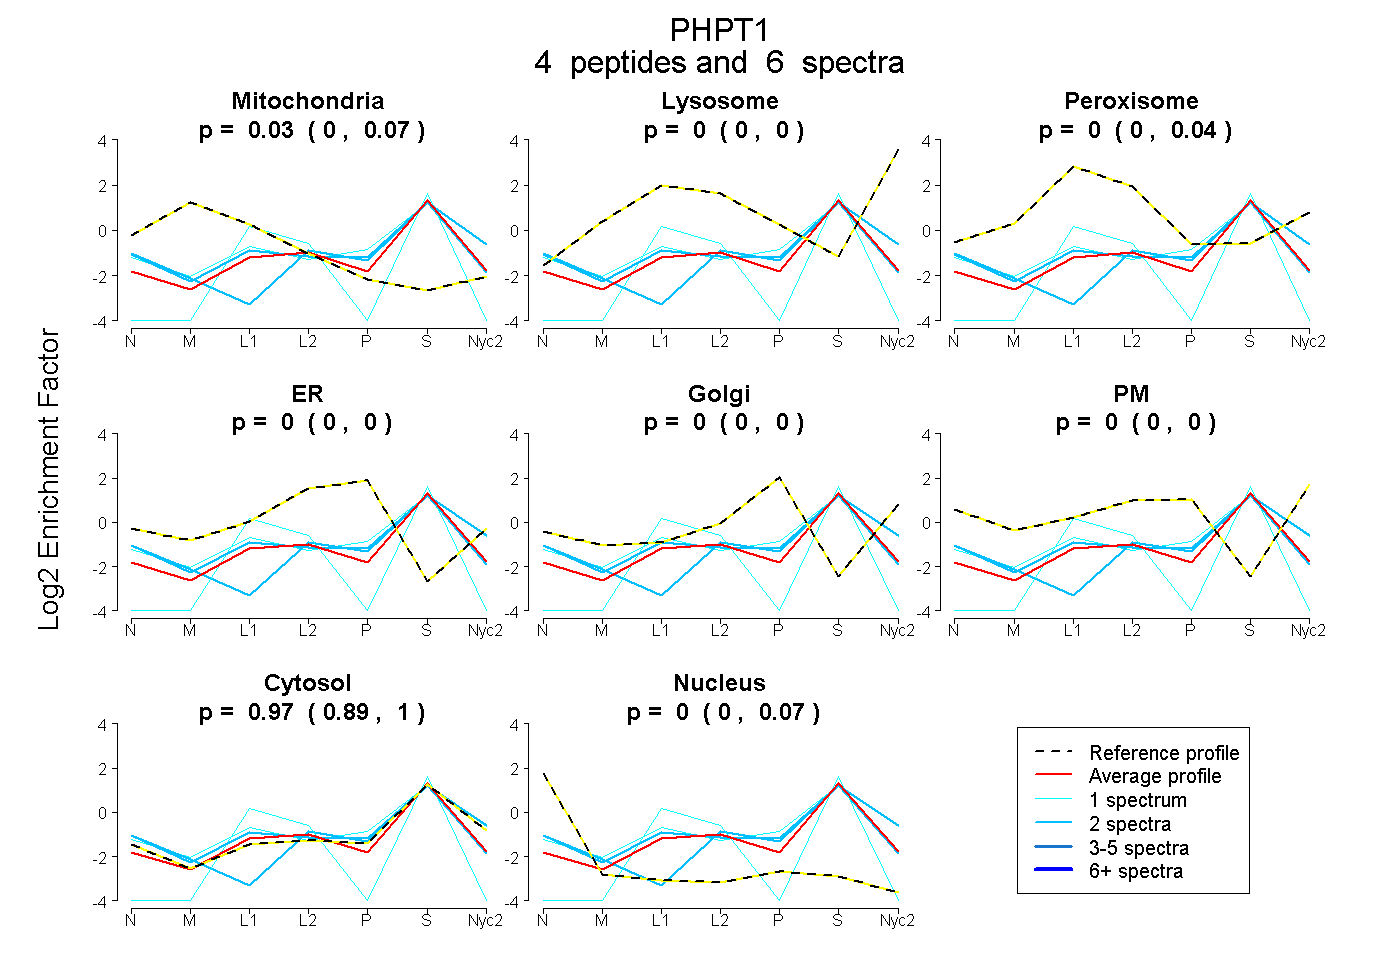 |
0.027
0.000 | 0.066 |
0.000
0.000 | 0.000 |
|
0.000
0.000 | 0.035 |
0.000
0.000 | 0.000 |
0.000
0.000 | 0.000 |
0.000
0.000 | 0.000 |
0.968
0.894 | 1.000 |
0.005
0.000 | 0.071 |
|
| | | Plot |
Mito |
|
Lyso or Perox |
|
ER |
Golgi |
PM |
Cytosol |
Nucleus |
|
| Expt B |
3
peptides |
5
spectra |
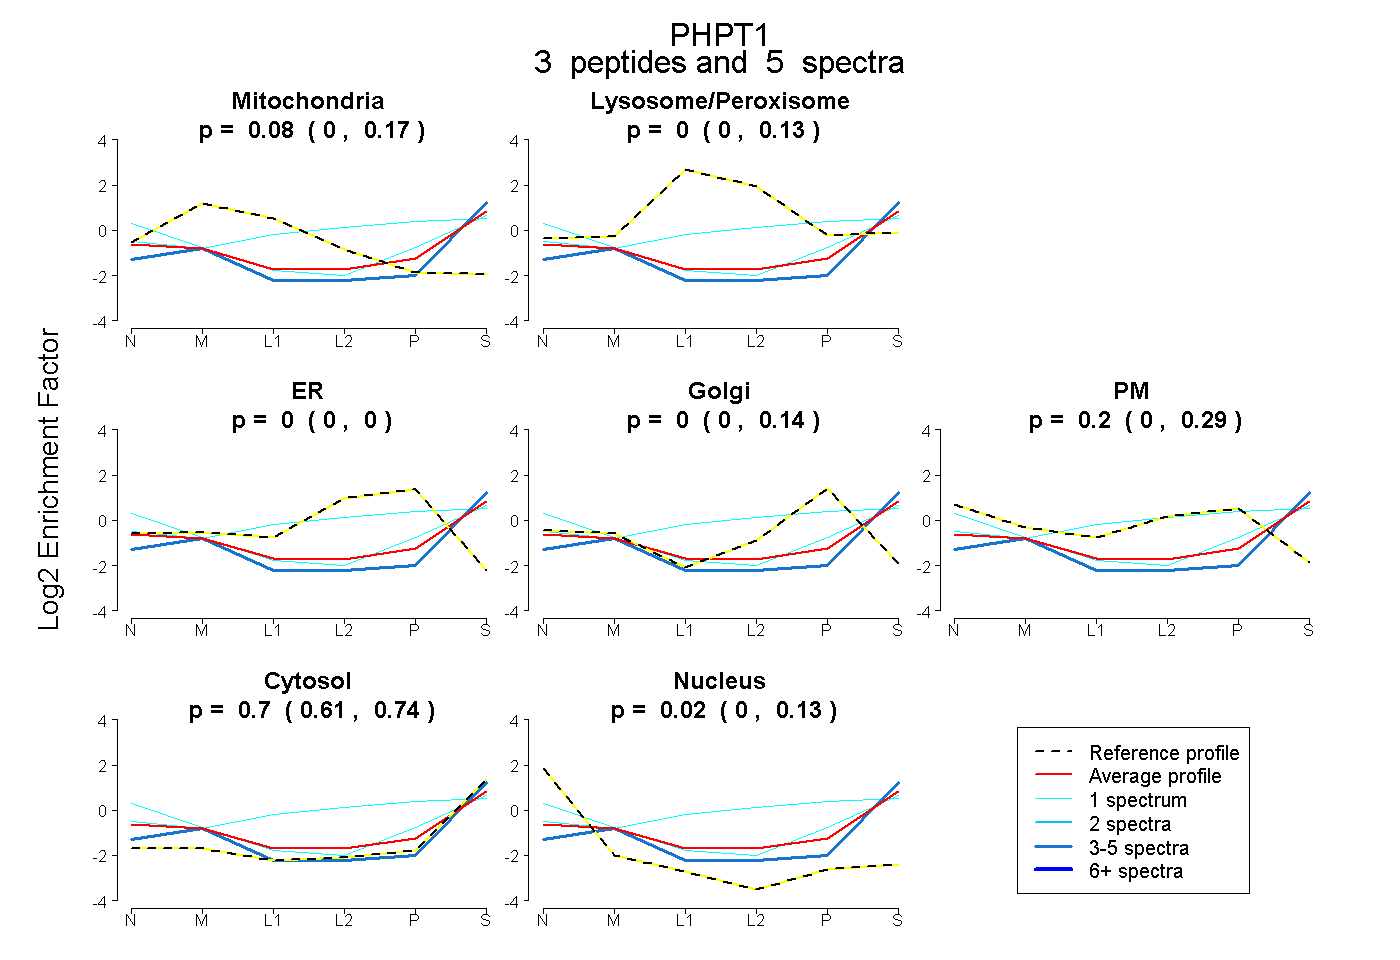 |
0.075
0.000 | 0.166 |
|
0.003
0.000 | 0.132 |
|
0.000
0.000 | 0.000 |
0.000
0.000 | 0.136 |
0.203
0.000 | 0.286 |
0.699
0.607 | 0.741 |
0.020
0.000 | 0.127 |
|
| 1 spectrum, AQHSVSTEK |
0.000 |
|
0.000 |
|
0.000 |
0.000 |
0.316 |
0.560 |
0.124 |
|
| 1 spectrum, NGYDCECLGGGR |
0.000 |
|
0.436 |
|
0.000 |
0.279 |
0.000 |
0.285 |
0.000 |
|
| 3 spectra, VHLAEPSGDPAR |
0.099 |
|
0.000 |
|
0.000 |
0.000 |
0.000 |
0.869 |
0.033 |
|
| | | Plot |
|
Lyso |
|
|
|
|
|
|
|
Other |
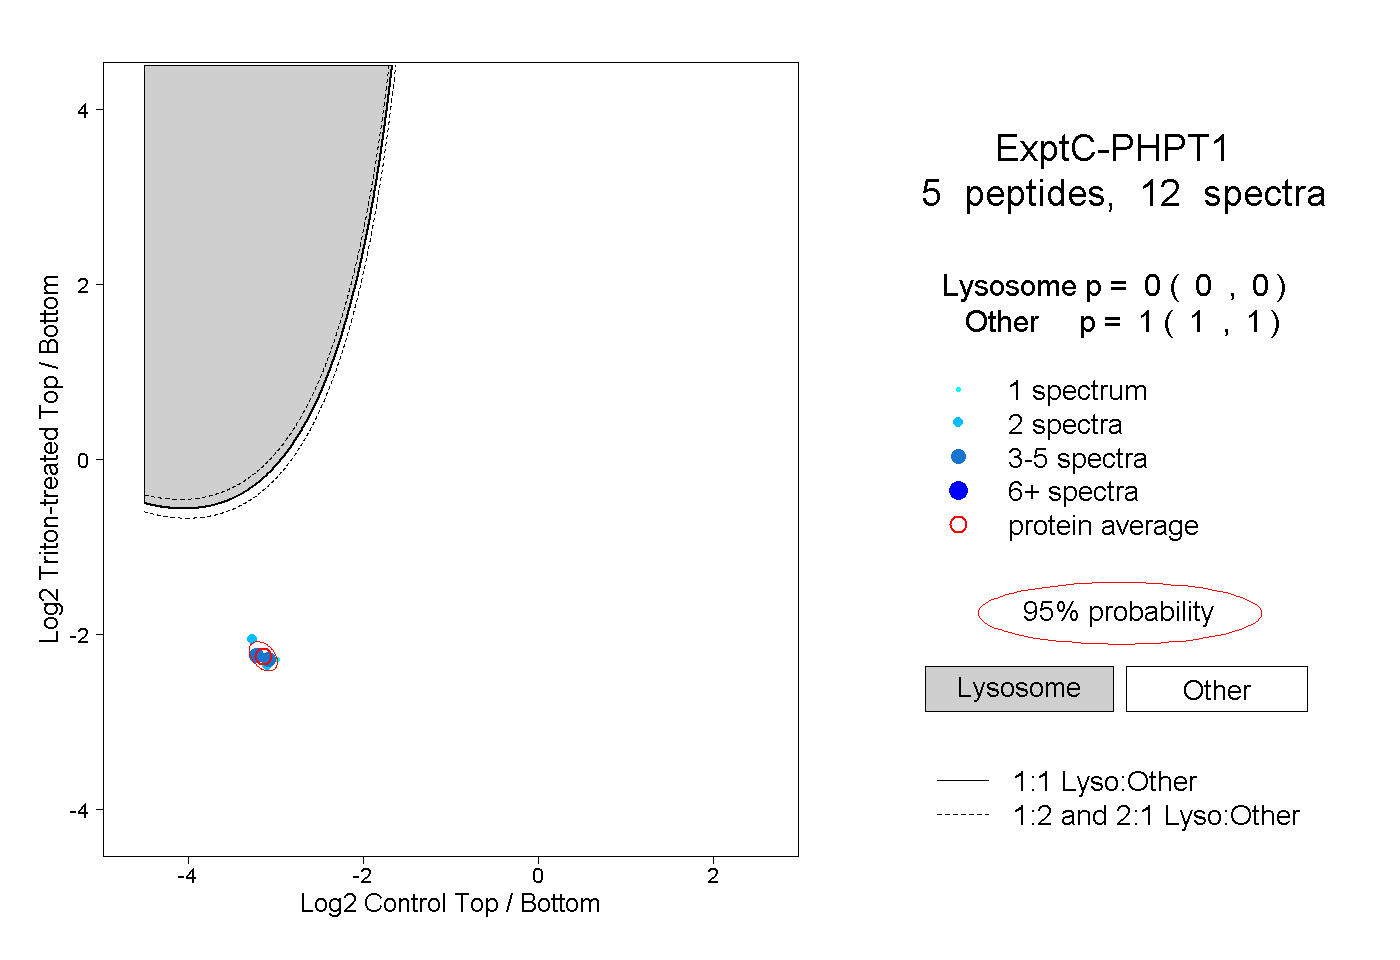
| Expt C |
5
peptides |
12
spectra |
 |
|
0.000
0.000 | 0.000 |
|
|
|
|
|
|
|
1.000
1.000 | 1.000 |