 6
6peptides
spectra
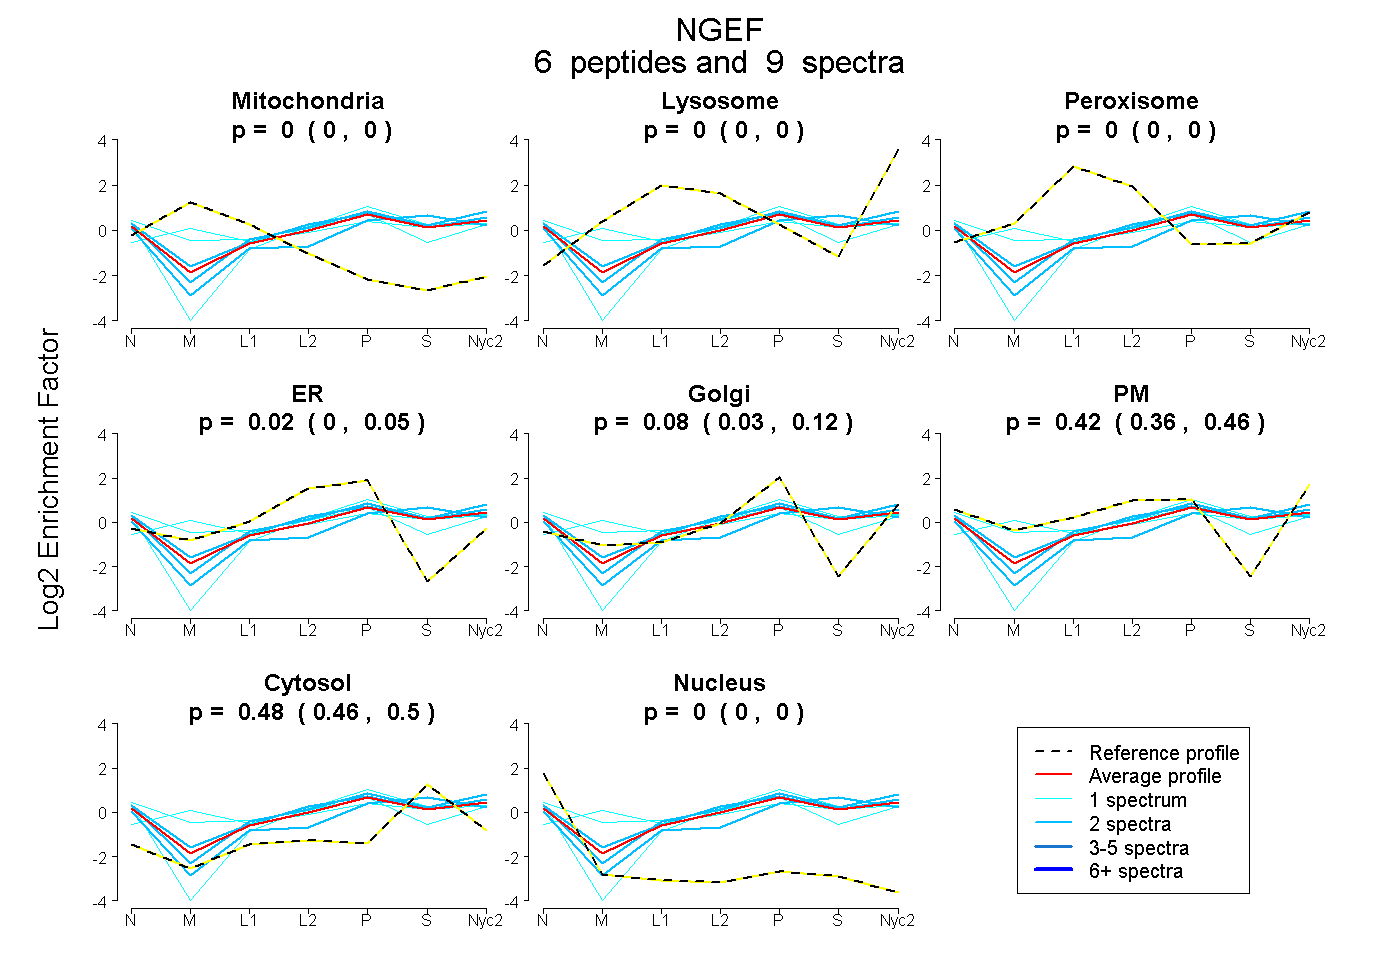
0.000 | 0.000
0.000 | 0.000
0.000 | 0.000
0.000 | 0.049
0.029 | 0.122
0.362 | 0.461
0.461 | 0.502
0.000 | 0.000
3peptides
spectra
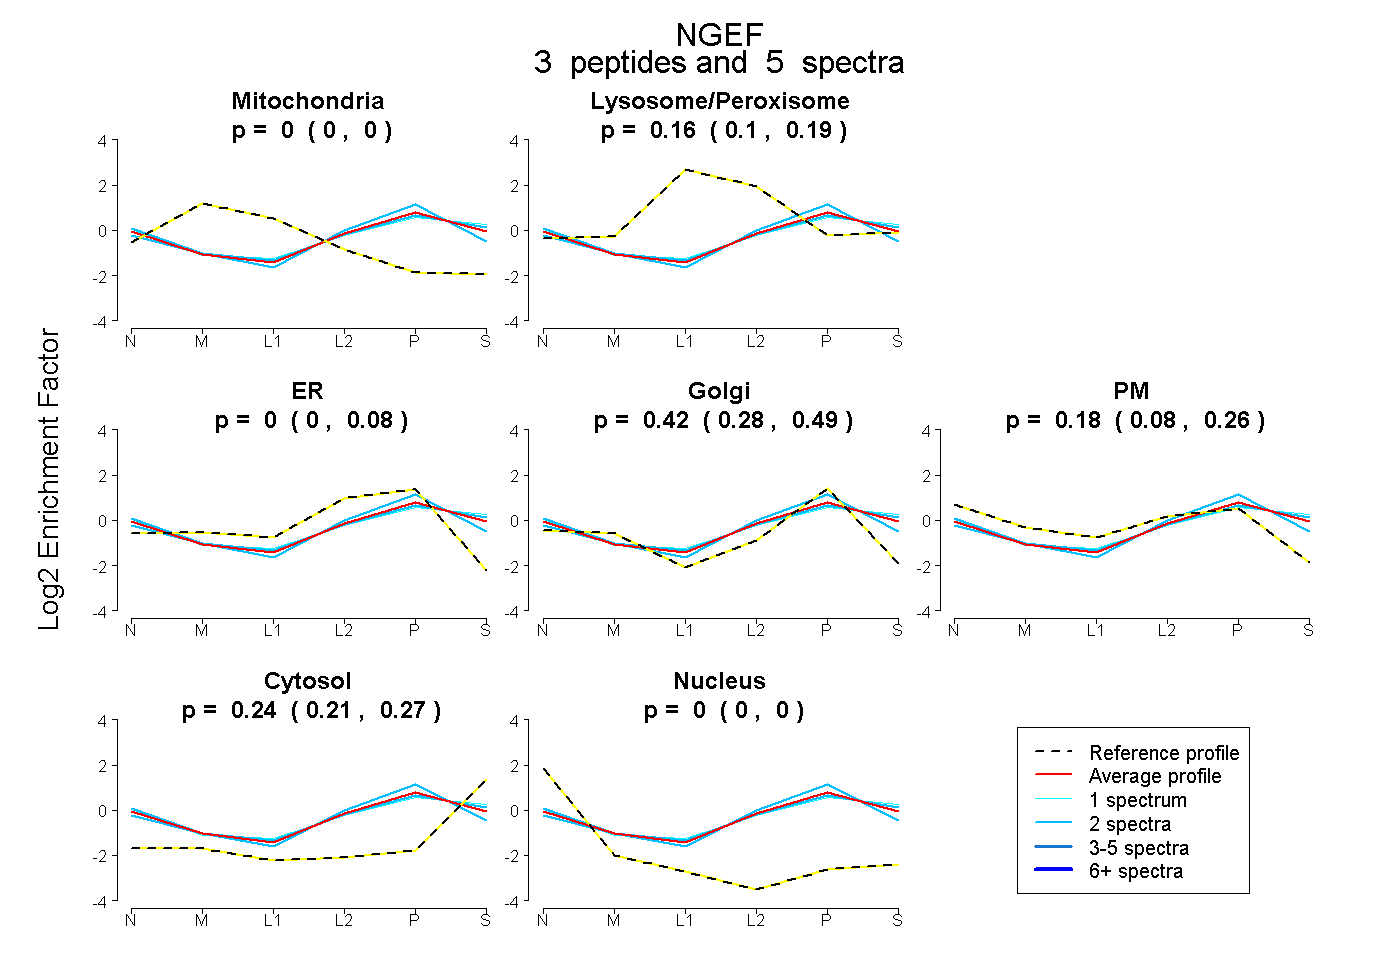
0.000 | 0.000
0.103 | 0.193
0.000 | 0.082
0.275 | 0.487
0.080 | 0.262
0.209 | 0.274
0.000 | 0.000
9peptides
spectra
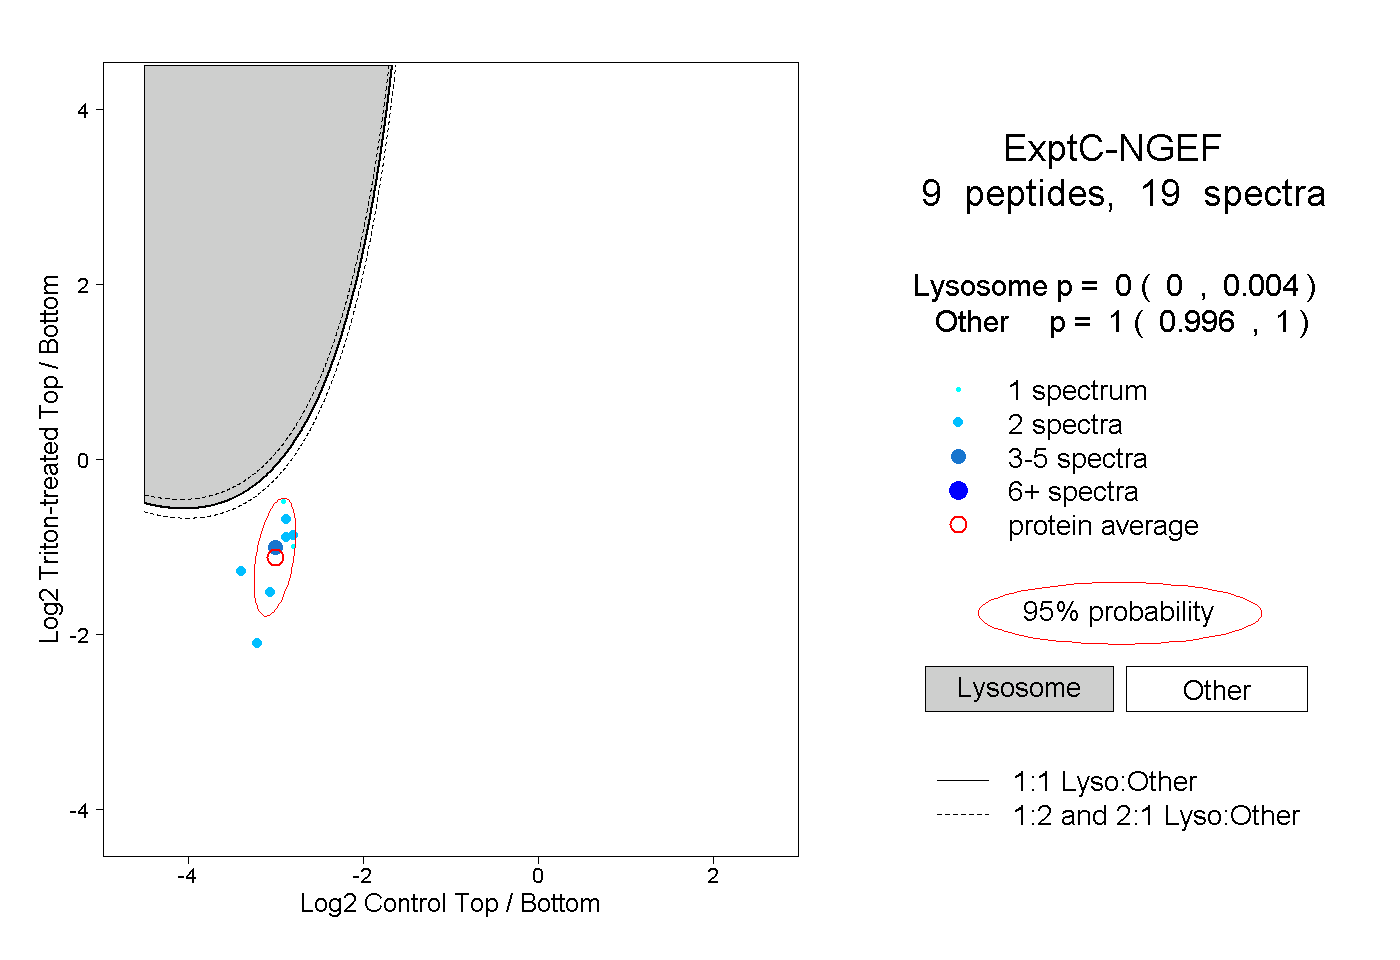
0.000 | 0.004
0.996 | 1.000
1peptide
spectrum
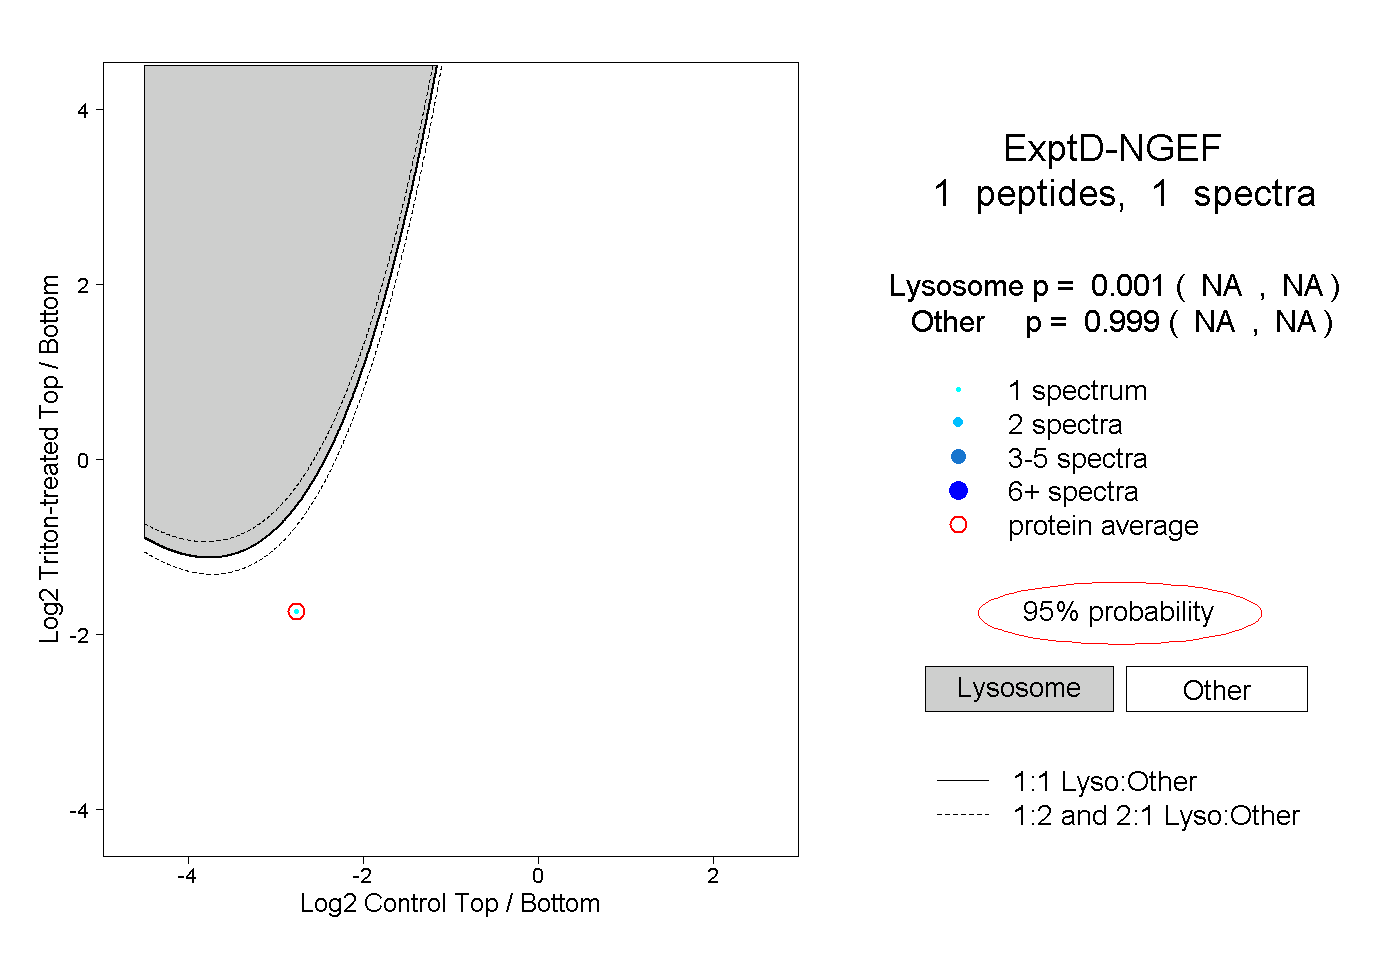
NA | NA
NA | NA