 6
6peptides
spectra
0.000 | 0.000
0.000 | 0.000
0.000 | 0.000
0.000 | 0.049
0.029 | 0.122
0.362 | 0.461
0.461 | 0.502
0.000 | 0.000
| Plot | Mito | Lyso | Perox | ER | Golgi | PM | Cytosol | Nucleus | |||||
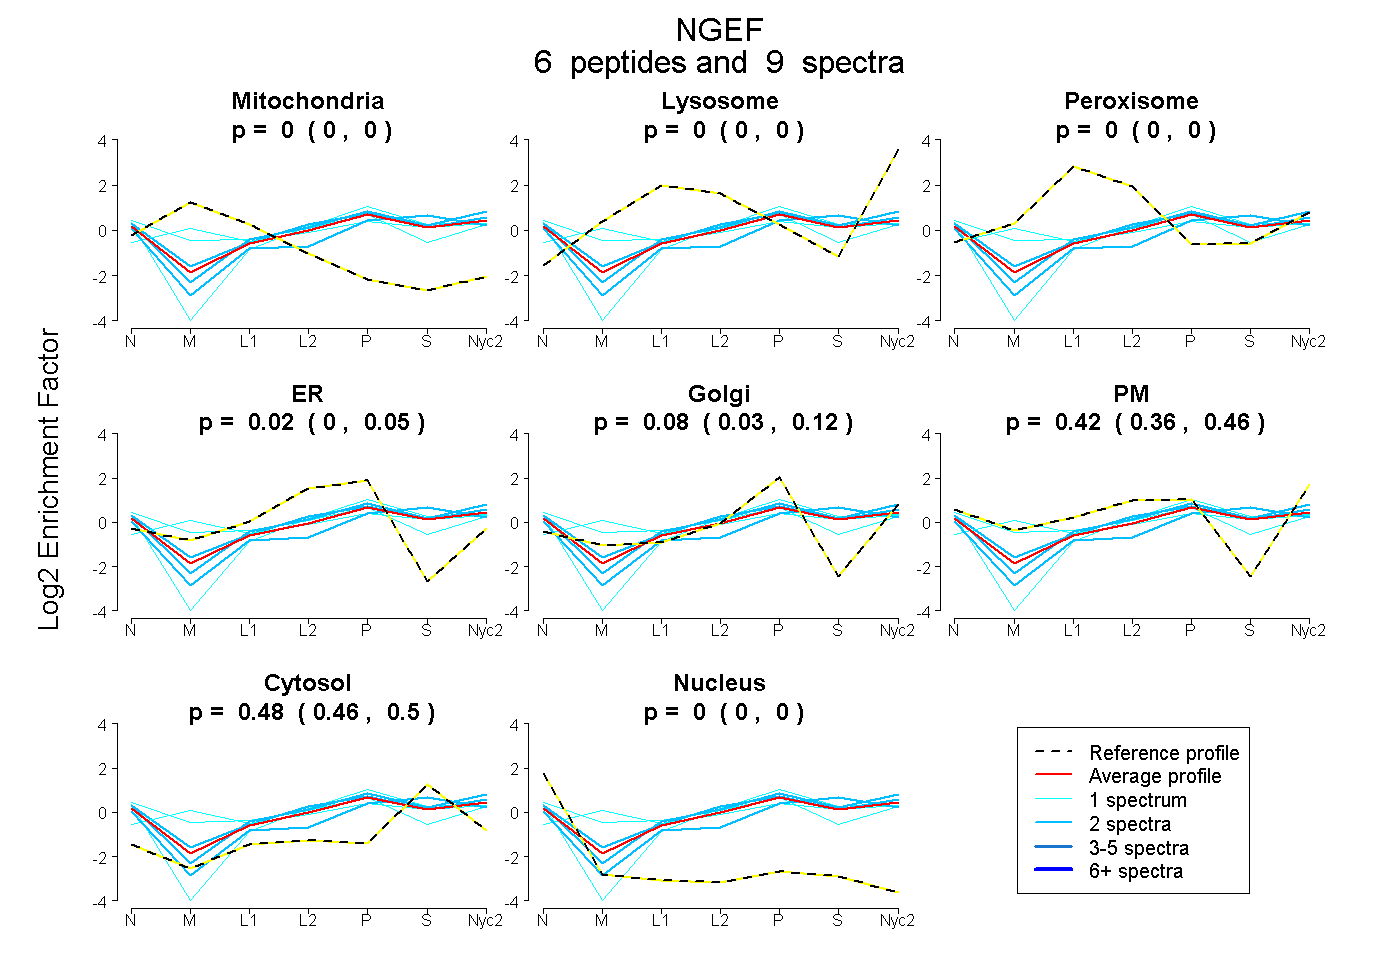
| Expt A |
6 peptides |
9 spectra |
|
0.000 0.000 | 0.000 |
0.000 0.000 | 0.000 |
0.000 0.000 | 0.000 |
0.017 0.000 | 0.049 |
0.081 0.029 | 0.122 |
0.418 0.362 | 0.461 |
0.484 0.461 | 0.502 |
0.000 0.000 | 0.000 |
| 2 spectra, TEDGWIFGER | 0.000 | 0.000 | 0.000 | 0.000 | 0.048 | 0.487 | 0.465 | 0.000 | ||
| 1 spectrum, ELIAQLELDPK | 0.041 | 0.000 | 0.021 | 0.078 | 0.008 | 0.530 | 0.323 | 0.000 | ||
| 1 spectrum, ELEMVVK | 0.000 | 0.000 | 0.000 | 0.098 | 0.282 | 0.085 | 0.535 | 0.000 | ||
| 2 spectra, STLQEIETR | 0.000 | 0.000 | 0.000 | 0.000 | 0.176 | 0.182 | 0.642 | 0.000 | ||
| 1 spectrum, SLNLLVSHFMENER | 0.079 | 0.109 | 0.164 | 0.000 | 0.309 | 0.000 | 0.339 | 0.000 | ||
| 2 spectra, FLLELEHR | 0.000 | 0.000 | 0.000 | 0.034 | 0.000 | 0.518 | 0.448 | 0.000 |
| Plot | Mito | Lyso or Perox | ER | Golgi | PM | Cytosol | Nucleus | ||||||
| Expt B |
3 peptides |
5 spectra |
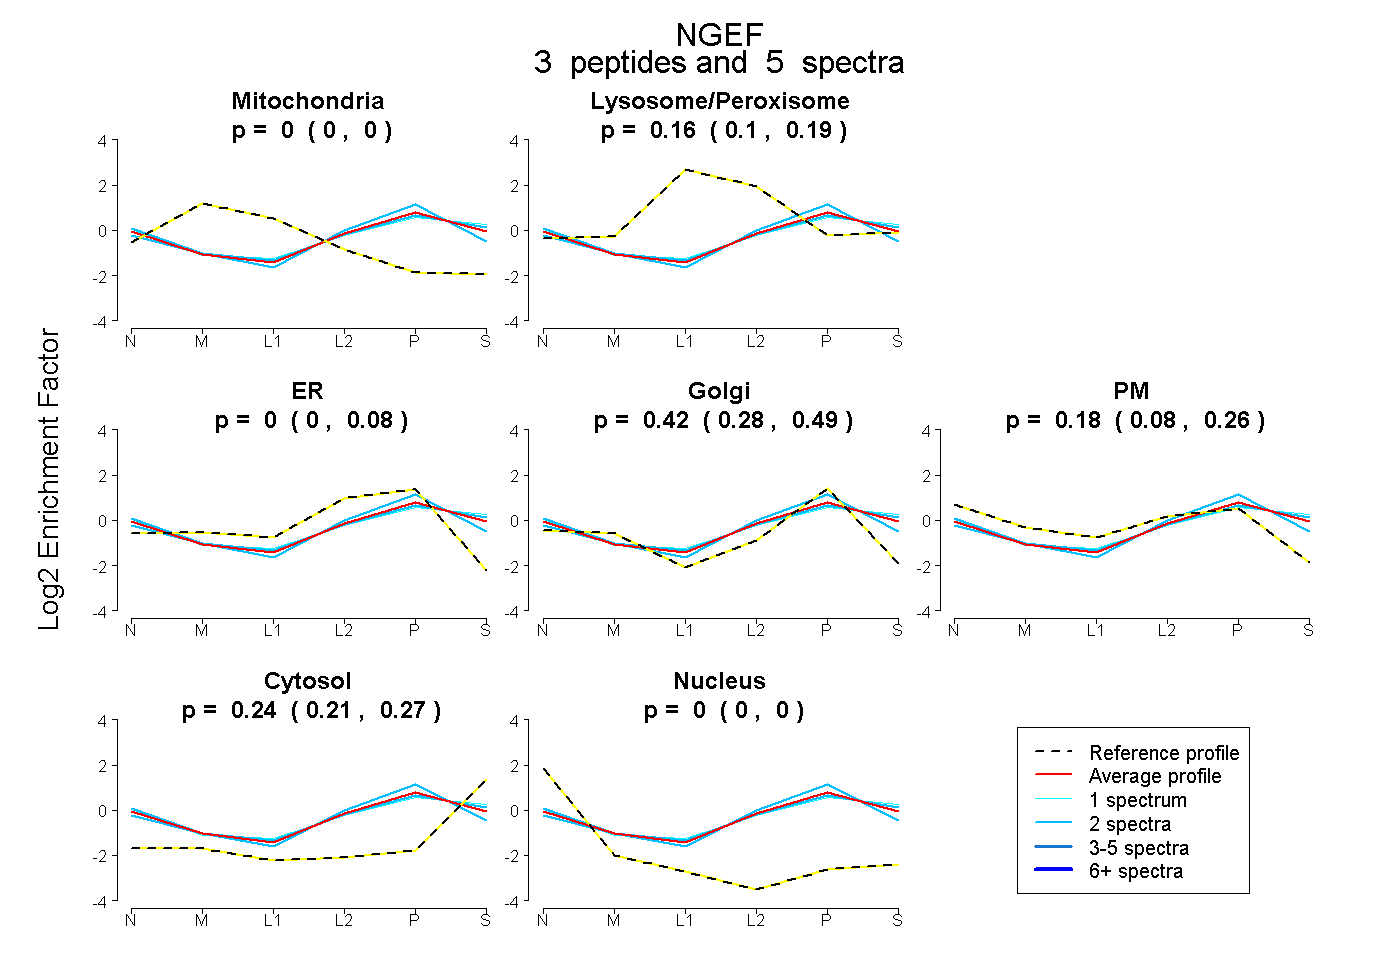 |
0.000 0.000 | 0.000 |
0.165 0.103 | 0.193 |
0.000 0.000 | 0.082 |
0.418 0.275 | 0.487 |
0.177 0.080 | 0.262 |
0.240 0.209 | 0.274 |
0.000 0.000 | 0.000 |
|||
| Plot | Lyso | Other | |||||||||||
| Expt C |
9 peptides |
19 spectra |
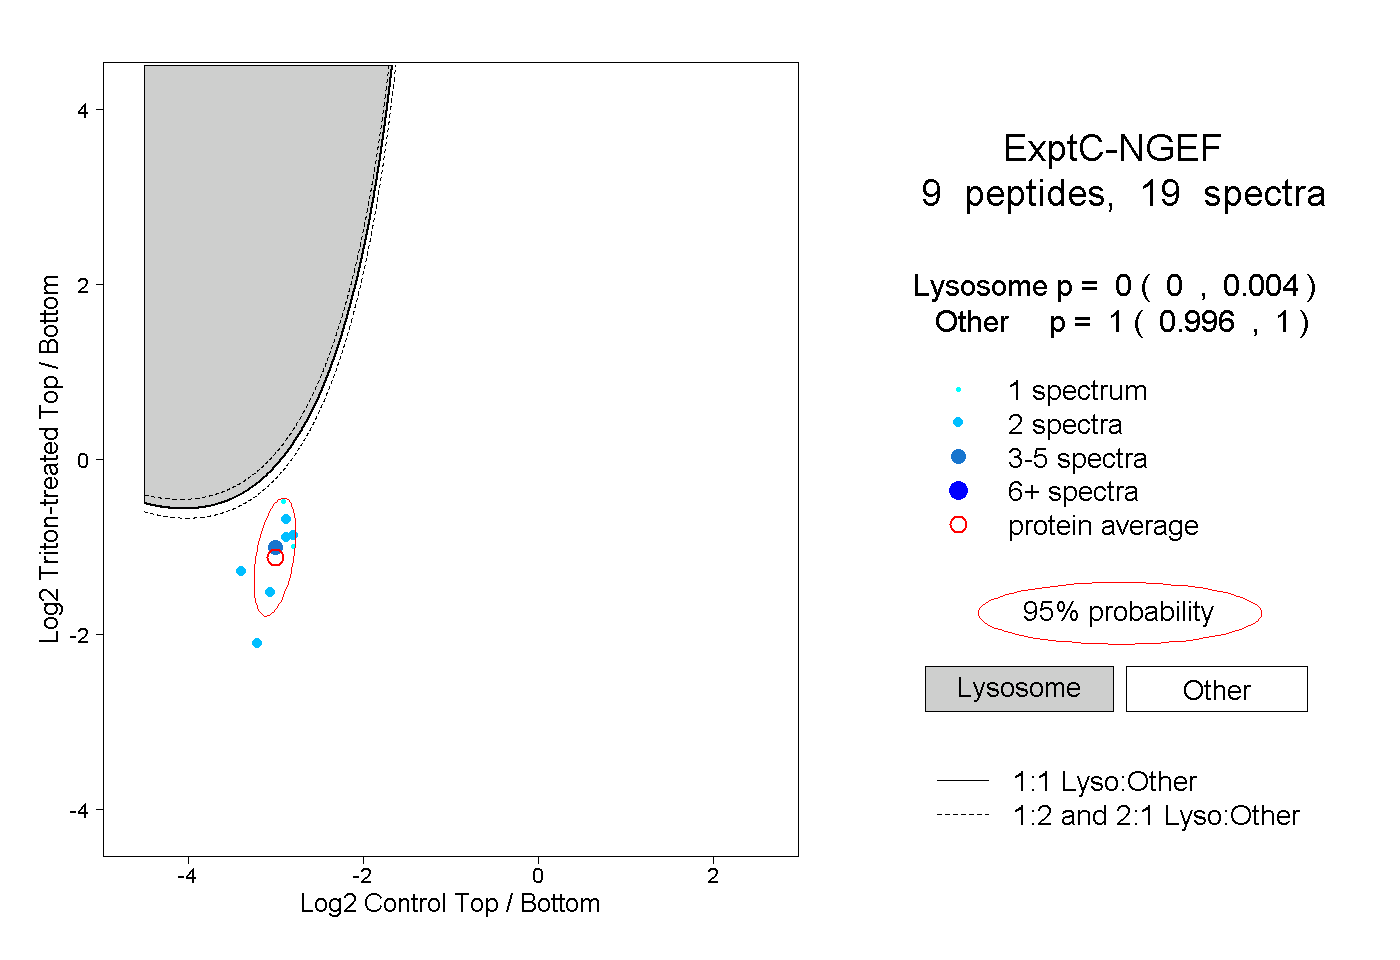 |
0.000 0.000 | 0.004 |
1.000 0.996 | 1.000 |
||||||||
| Plot | Lyso | Other | |||||||||||
| Expt D |
1 peptide |
1 spectrum |
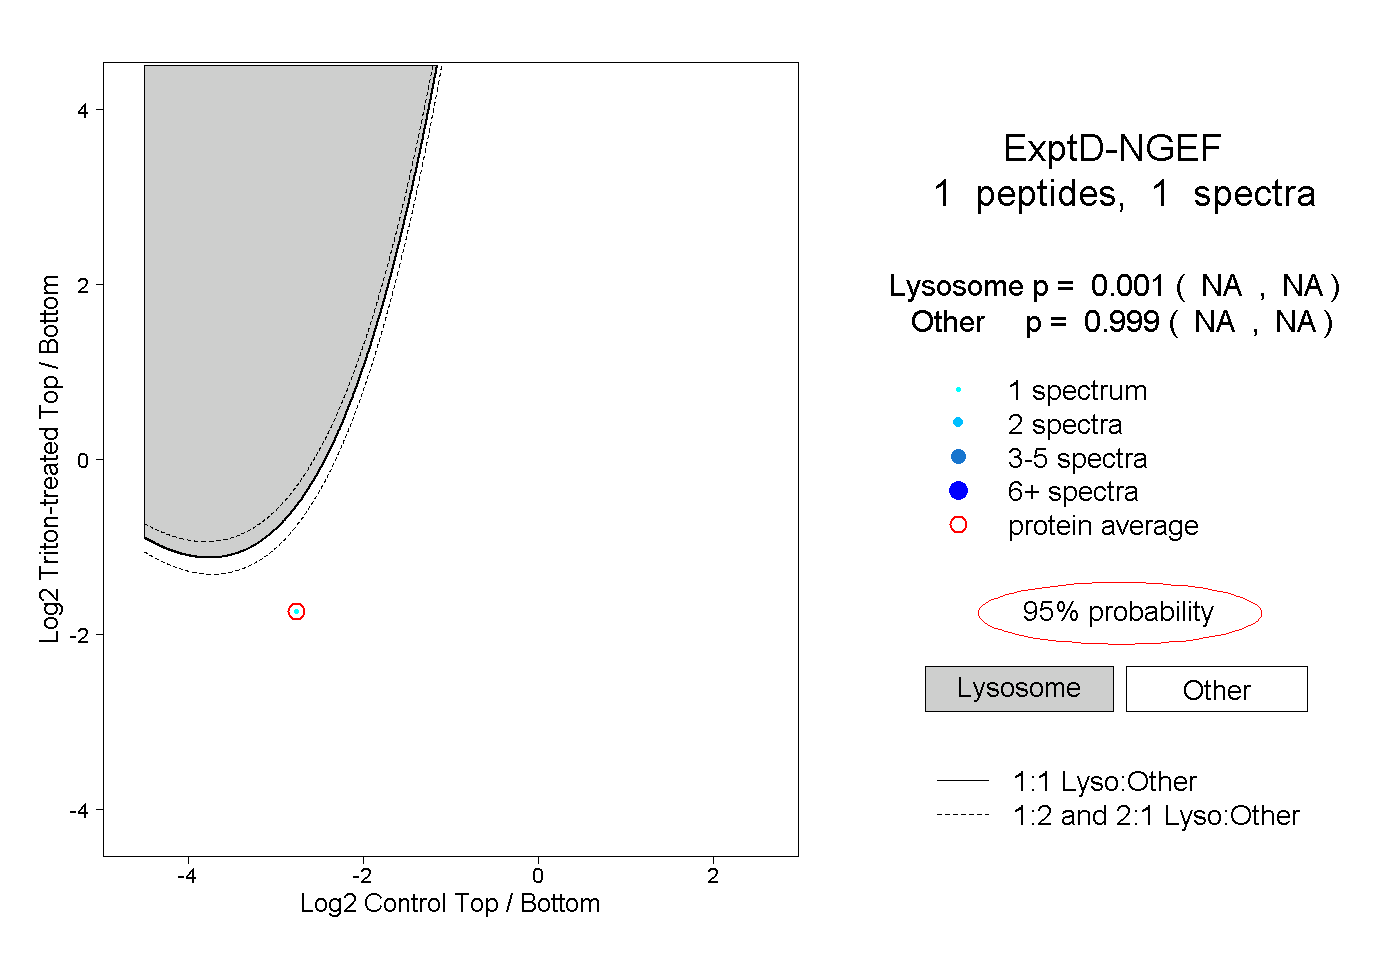 |
0.001 NA | NA |
0.999 NA | NA |