 4
4peptides
spectra
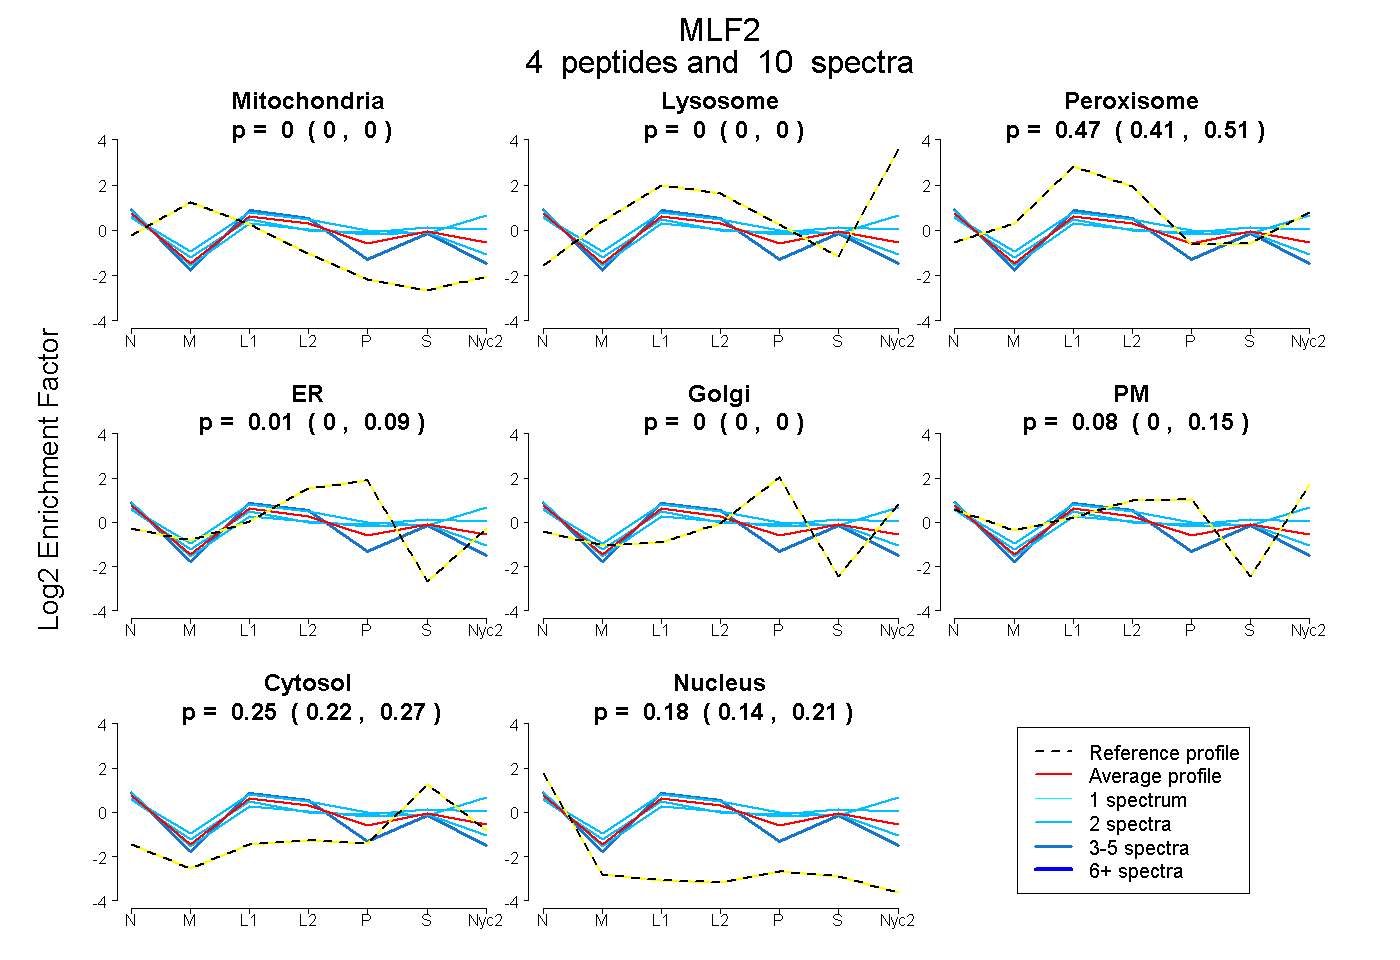
0.000 | 0.000
0.000 | 0.000
0.413 | 0.513
0.000 | 0.088
0.000 | 0.000
0.000 | 0.149
0.223 | 0.275
0.141 | 0.212
1peptide
spectrum
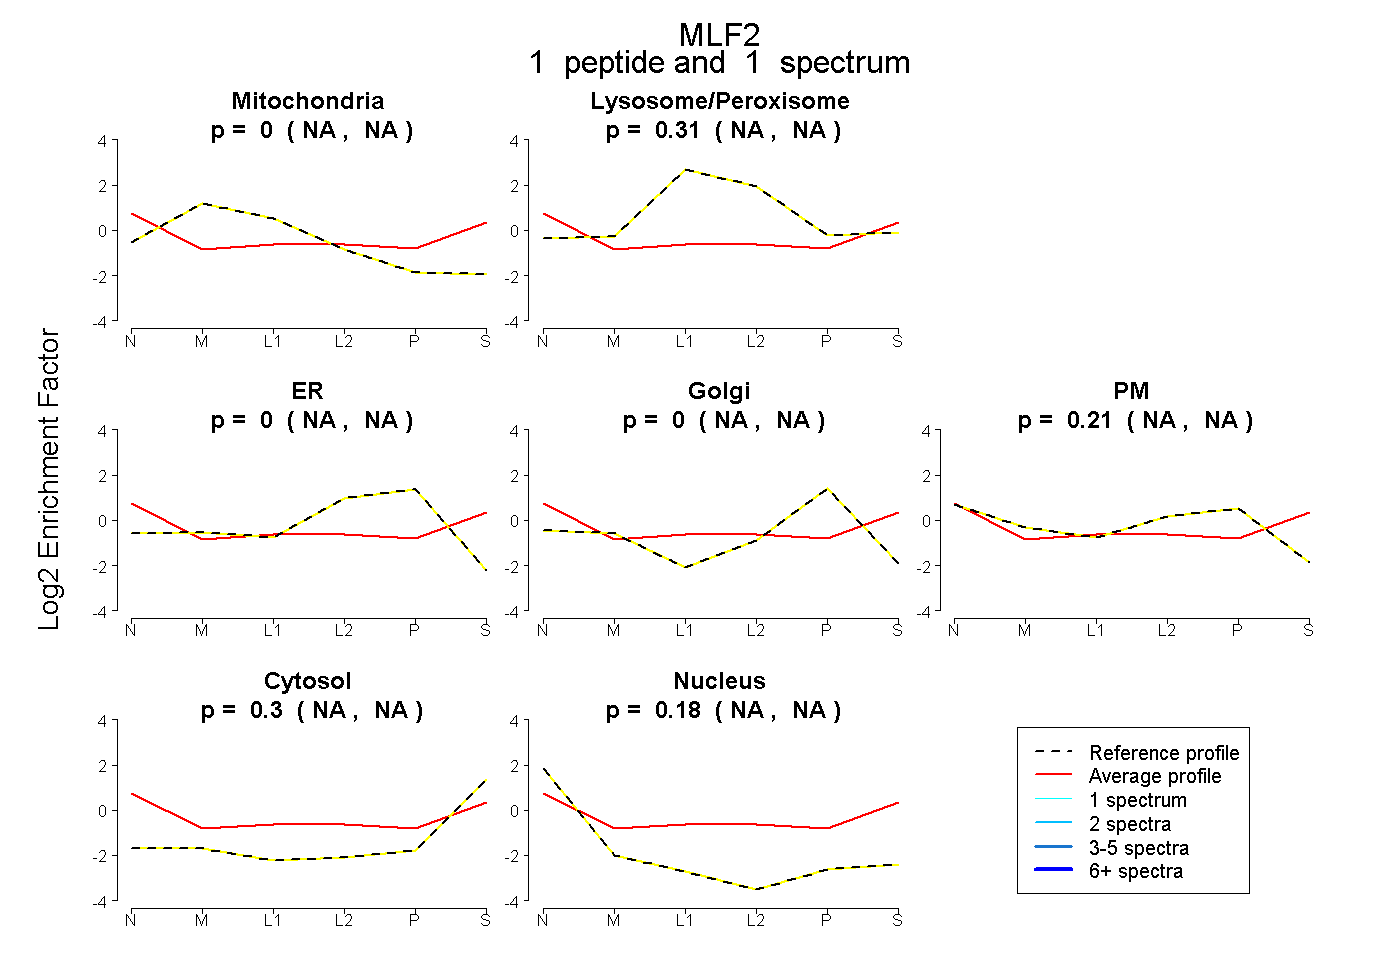
NA | NA
NA | NA
NA | NA
NA | NA
NA | NA
NA | NA
NA | NA
1peptide
spectra
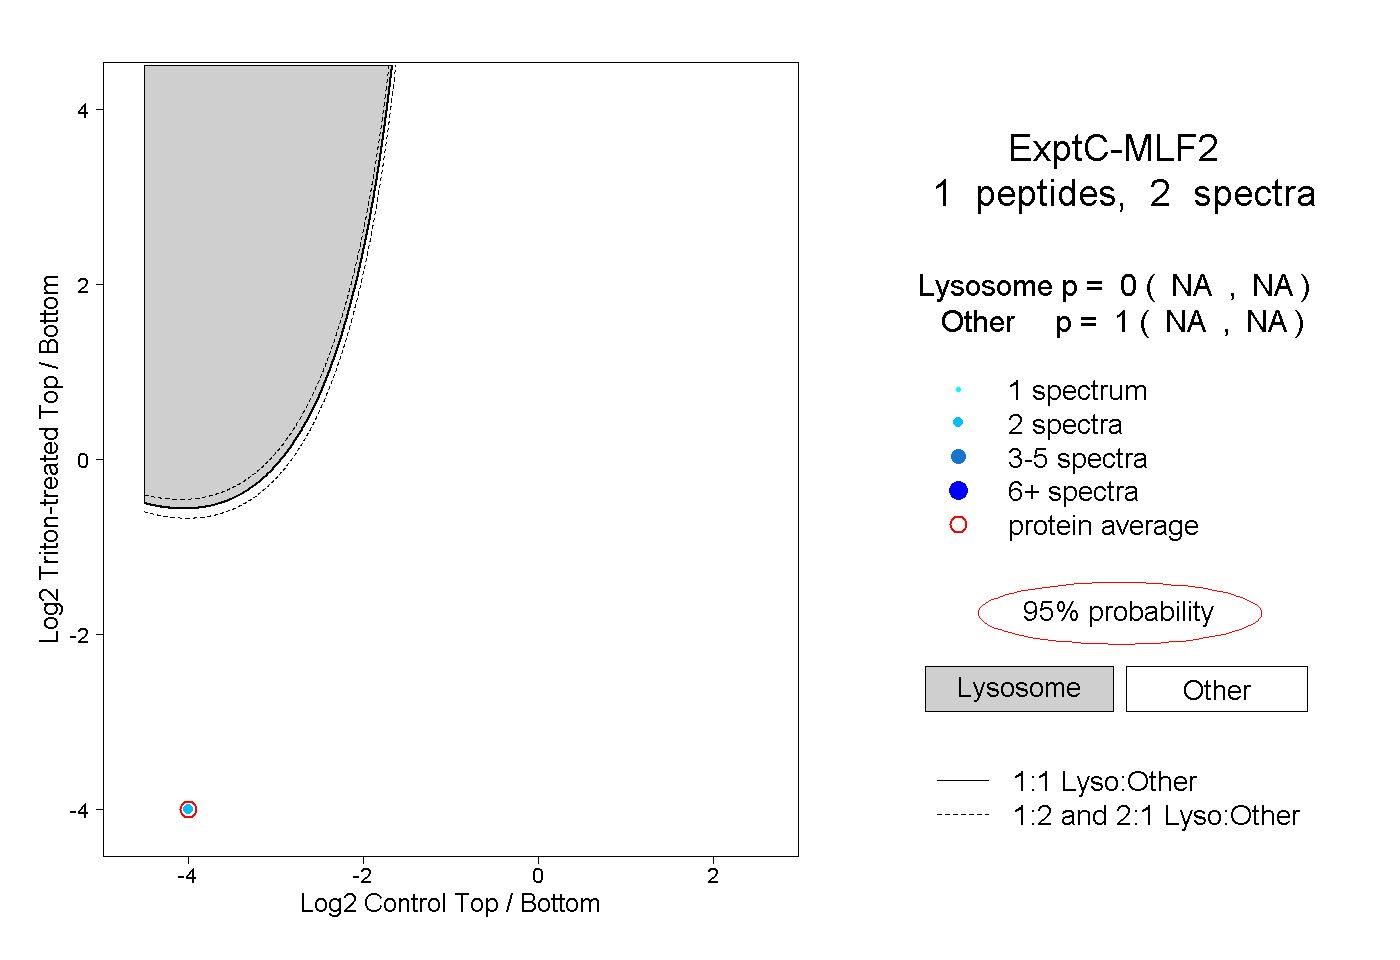
NA | NA
NA | NA