 4
4peptides
spectra
0.000 | 0.000
0.000 | 0.000
0.413 | 0.513
0.000 | 0.088
0.000 | 0.000
0.000 | 0.149
0.223 | 0.275
0.141 | 0.212
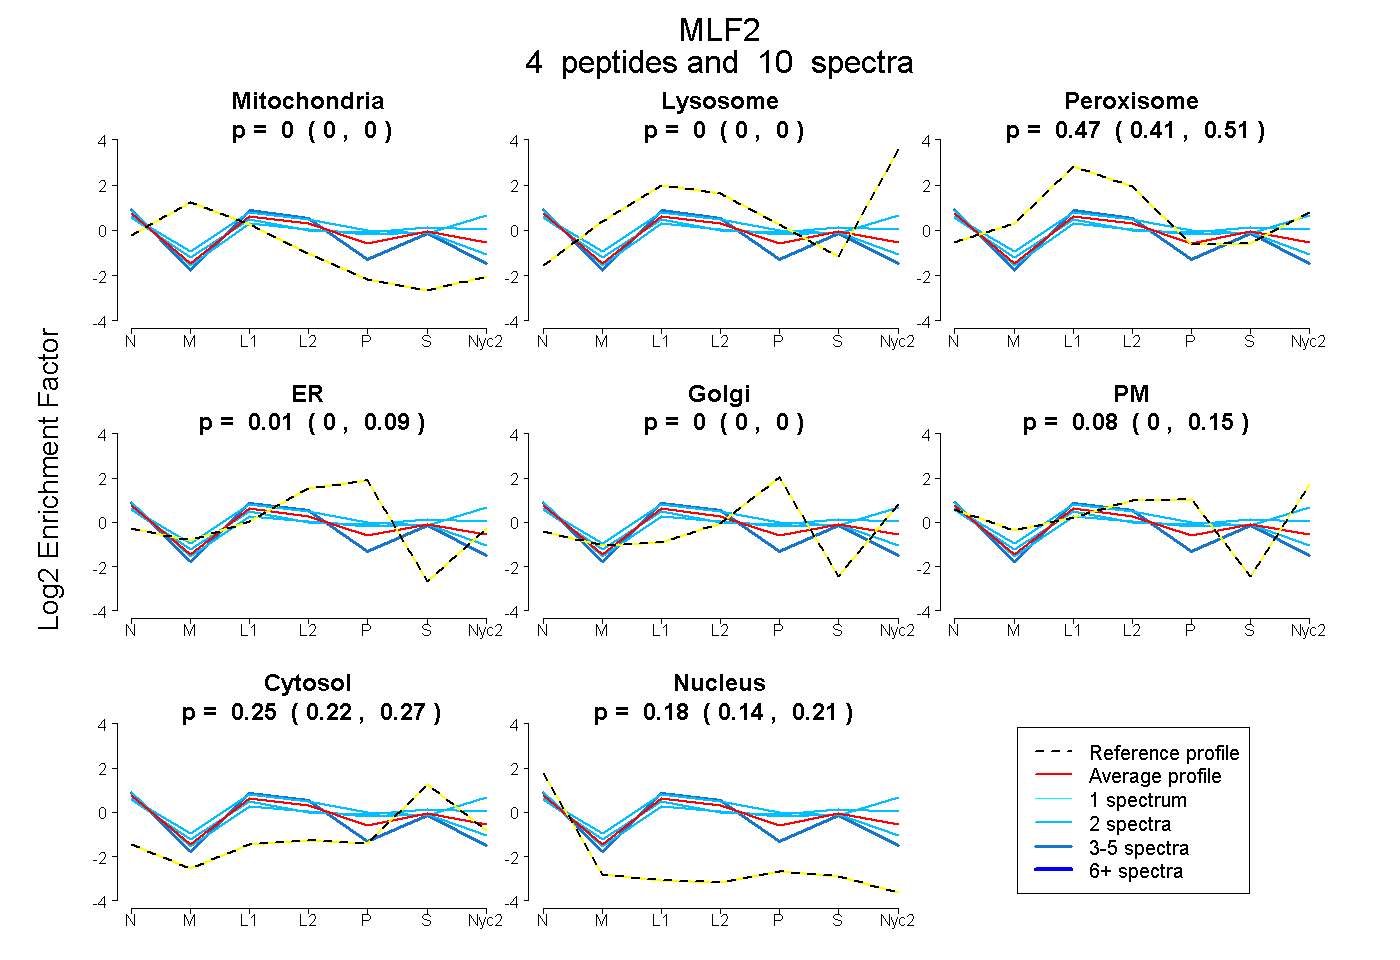
| Plot | Mito | Lyso | Perox | ER | Golgi | PM | Cytosol | Nucleus | |||||
| Expt A |
4 peptides |
10 spectra |
|
0.000 0.000 | 0.000 |
0.000 0.000 | 0.000 |
0.470 0.413 | 0.513 |
0.012 0.000 | 0.088 |
0.000 0.000 | 0.000 |
0.085 0.000 | 0.149 |
0.251 0.223 | 0.275 |
0.182 0.141 | 0.212 |
| 2 spectra, LAIQGPEDSPSR | 0.000 | 0.000 | 0.360 | 0.172 | 0.000 | 0.000 | 0.265 | 0.204 | ||
| 4 spectra, DVEPEDPMFLMDPFAIHR | 0.000 | 0.000 | 0.547 | 0.000 | 0.000 | 0.000 | 0.166 | 0.287 | ||
| 2 spectra, VYQETSEMR | 0.000 | 0.000 | 0.341 | 0.000 | 0.000 | 0.364 | 0.283 | 0.012 | ||
| 2 spectra, SAPGGIR | 0.000 | 0.000 | 0.306 | 0.000 | 0.000 | 0.269 | 0.363 | 0.062 |
| Plot | Mito | Lyso or Perox | ER | Golgi | PM | Cytosol | Nucleus | ||||||
| Expt B |
1 peptide |
1 spectrum |
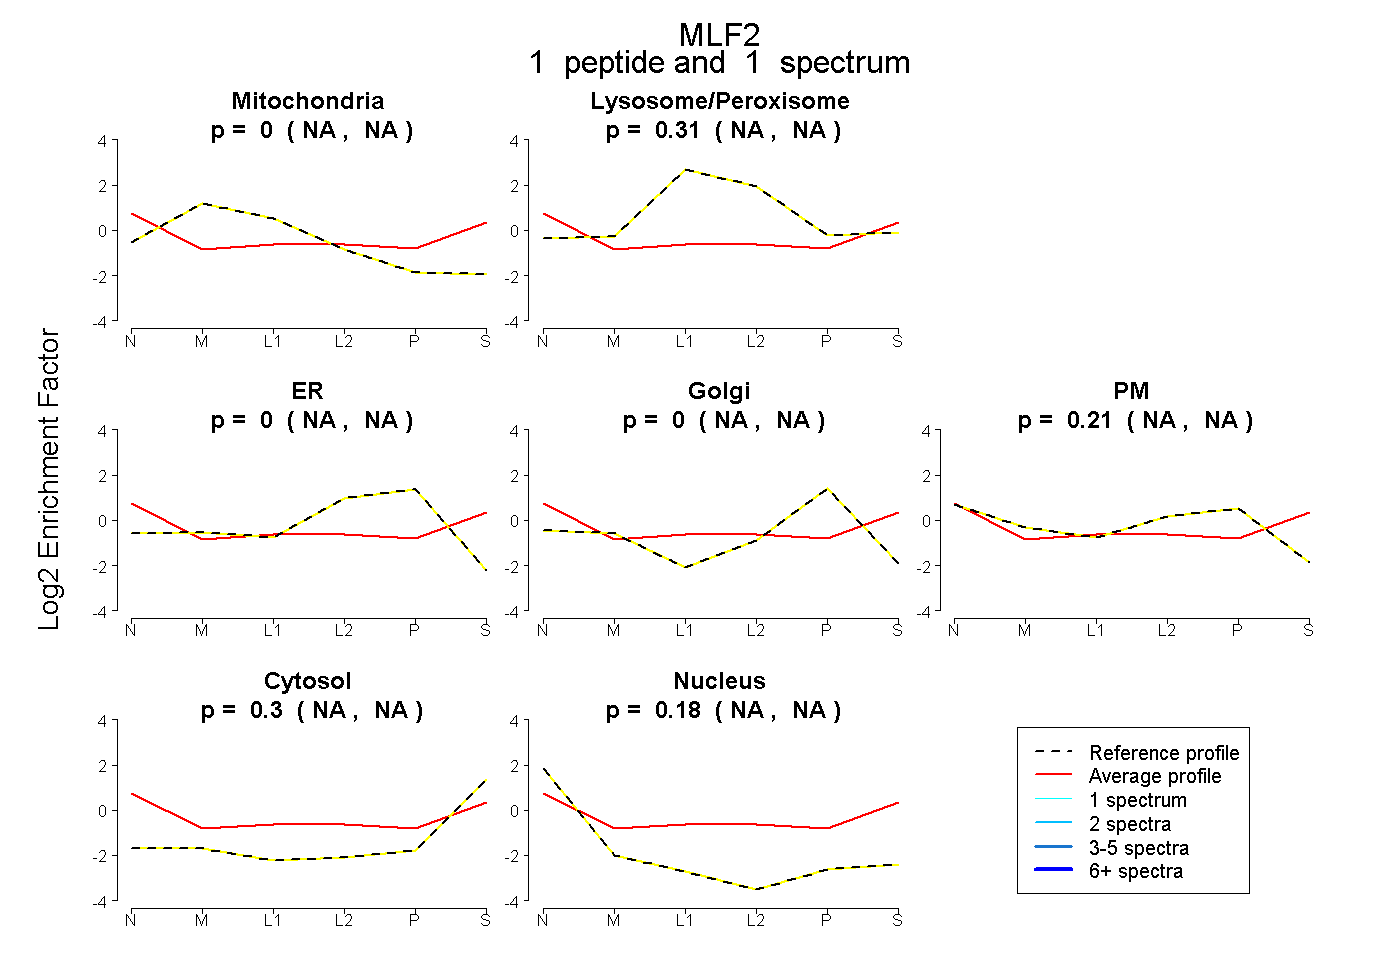 |
0.000 NA | NA |
0.306 NA | NA |
0.000 NA | NA |
0.000 NA | NA |
0.208 NA | NA |
0.303 NA | NA |
0.184 NA | NA |
|||
| Plot | Lyso | Other | |||||||||||
| Expt C |
1 peptide |
2 spectra |
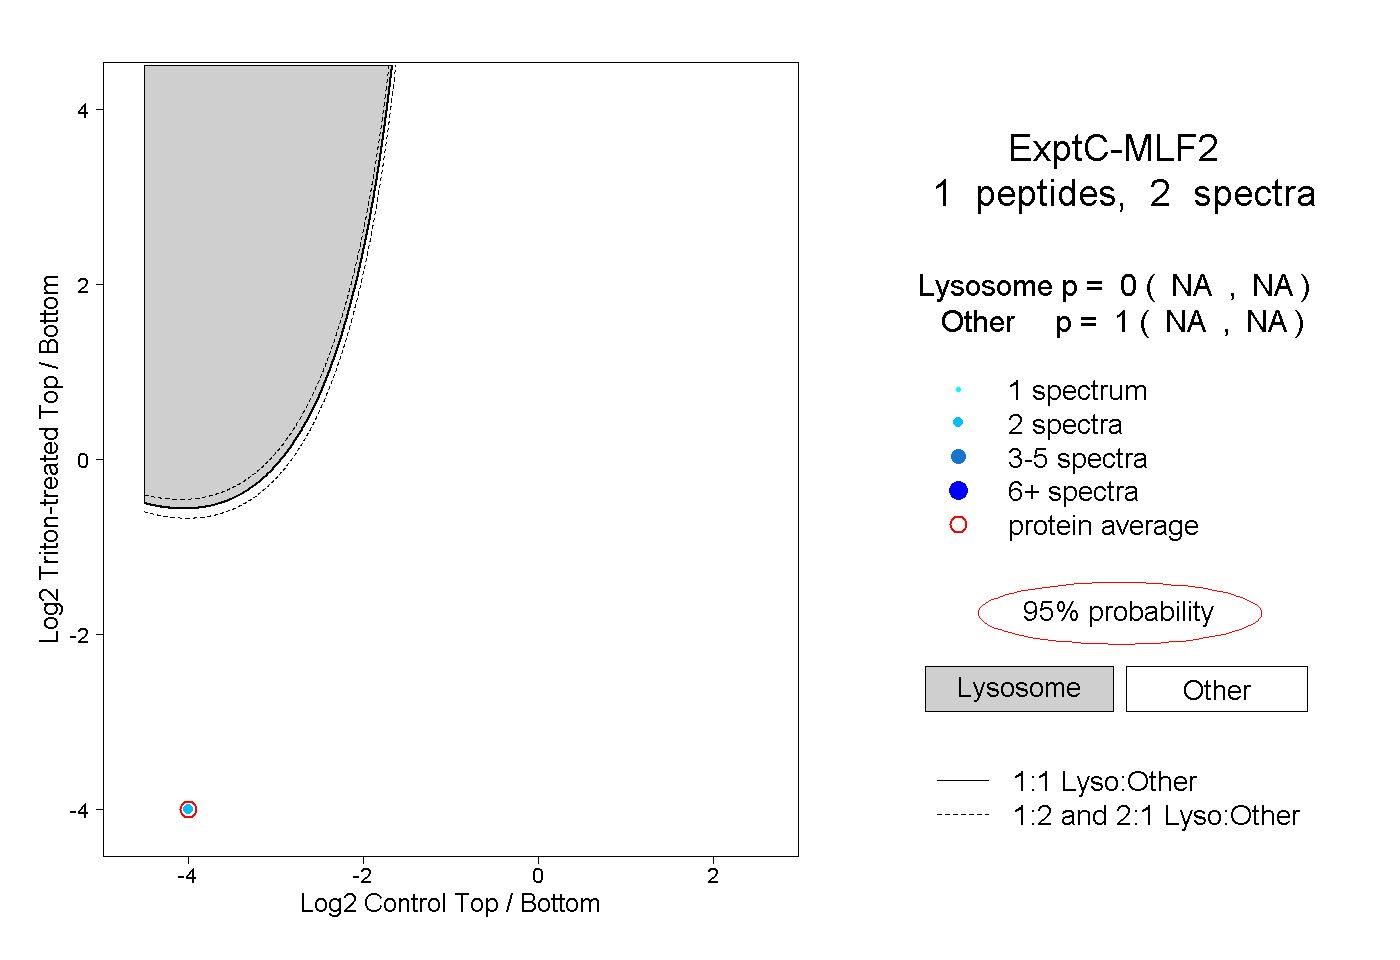 |
0.000 NA | NA |
1.000 NA | NA |