 24
24peptides
spectra
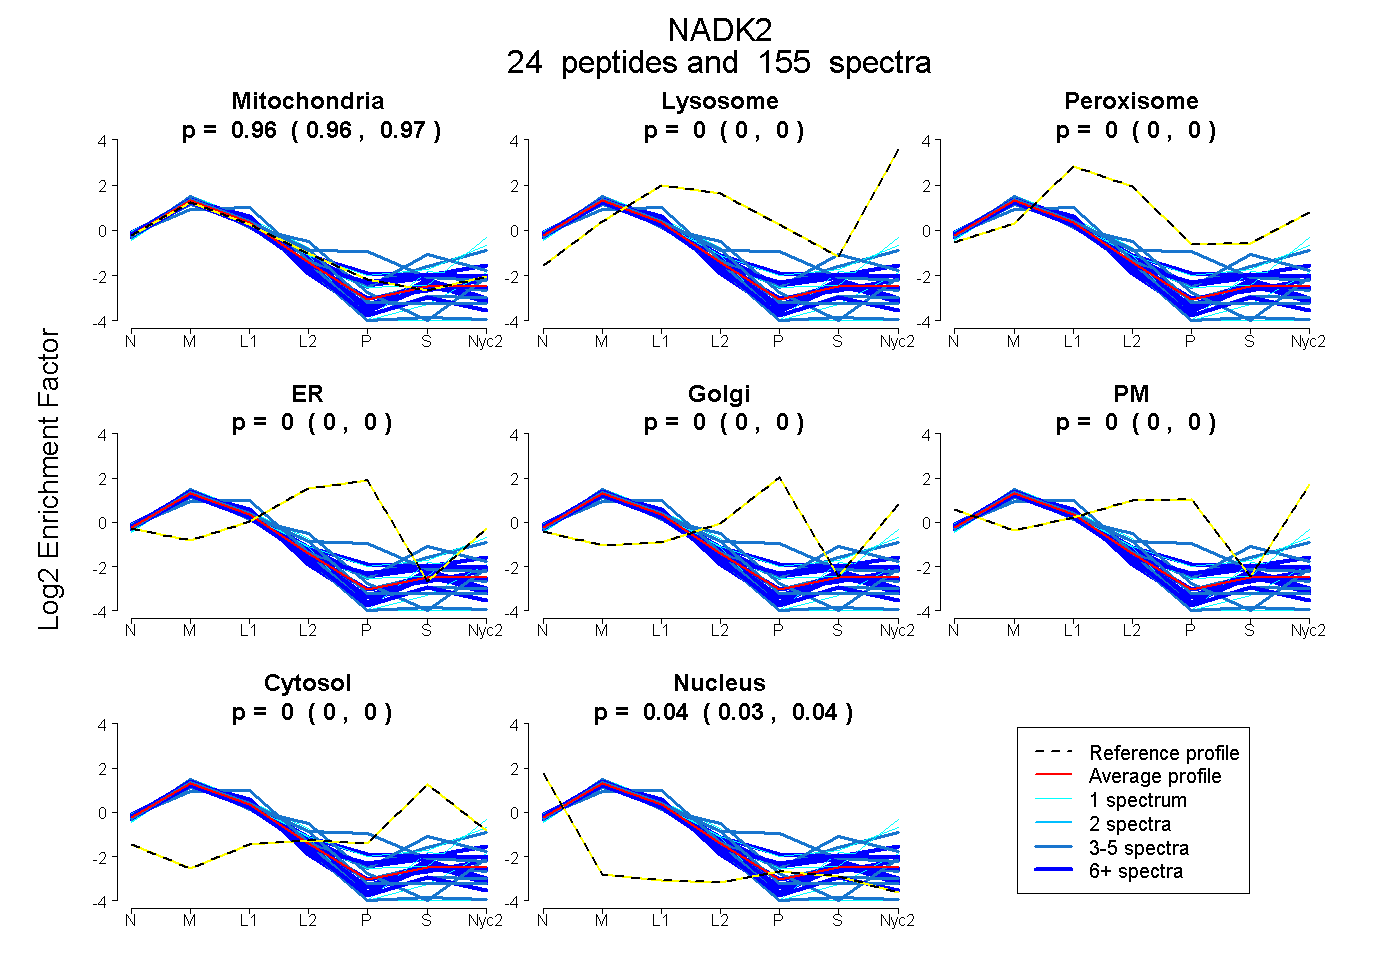
0.963 | 0.966
0.000 | 0.000
0.000 | 0.000
0.000 | 0.000
0.000 | 0.000
0.000 | 0.000
0.000 | 0.000
0.034 | 0.037
21peptides
spectra
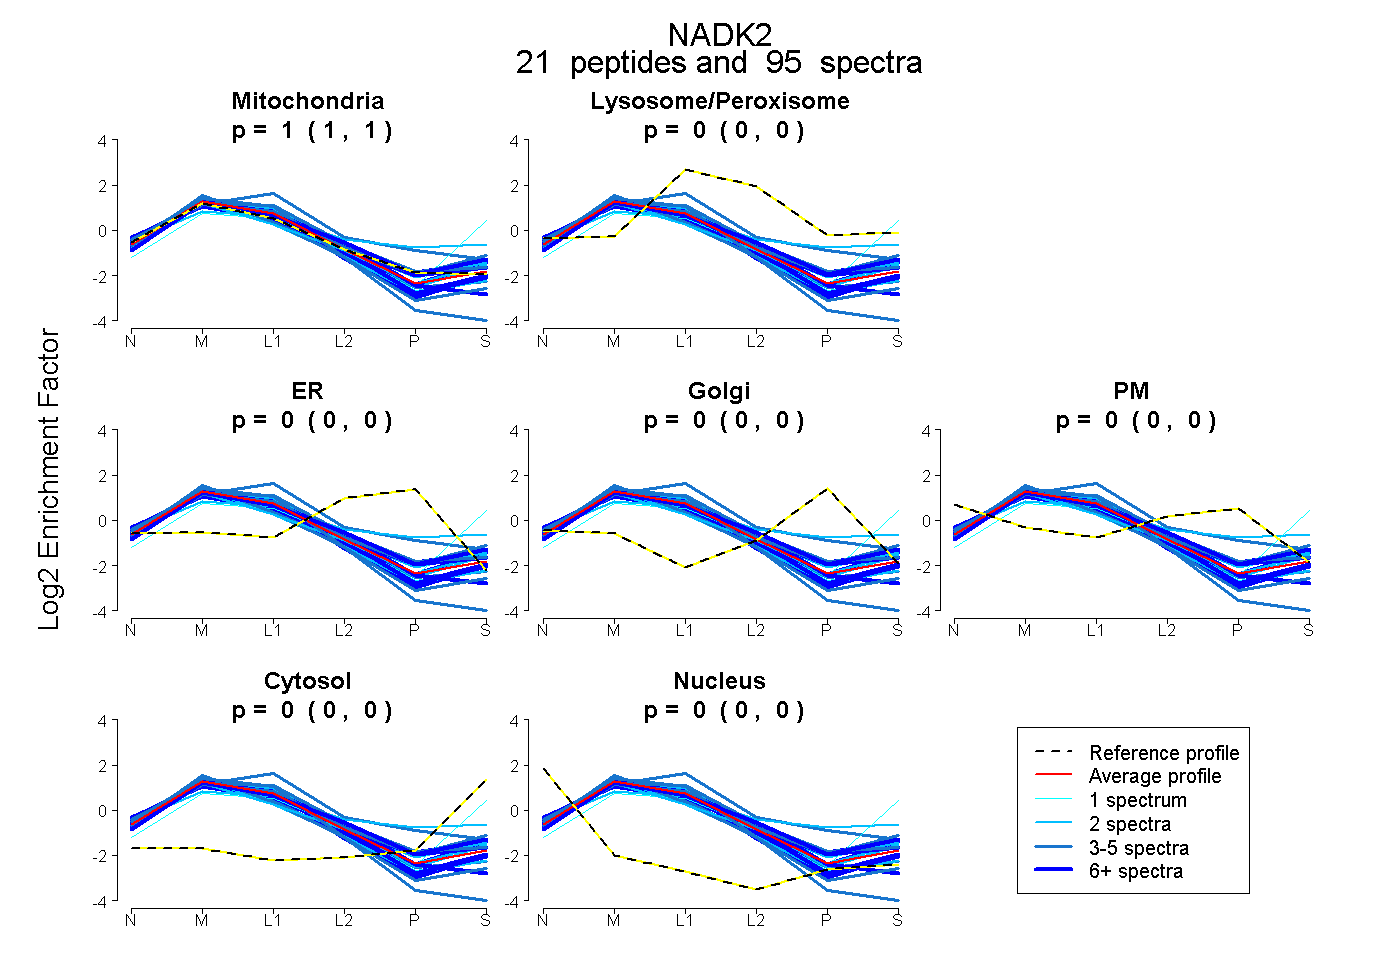
1.000 | 1.000
0.000 | 0.000
0.000 | 0.000
0.000 | 0.000
0.000 | 0.000
0.000 | 0.000
0.000 | 0.000
25peptides
spectra
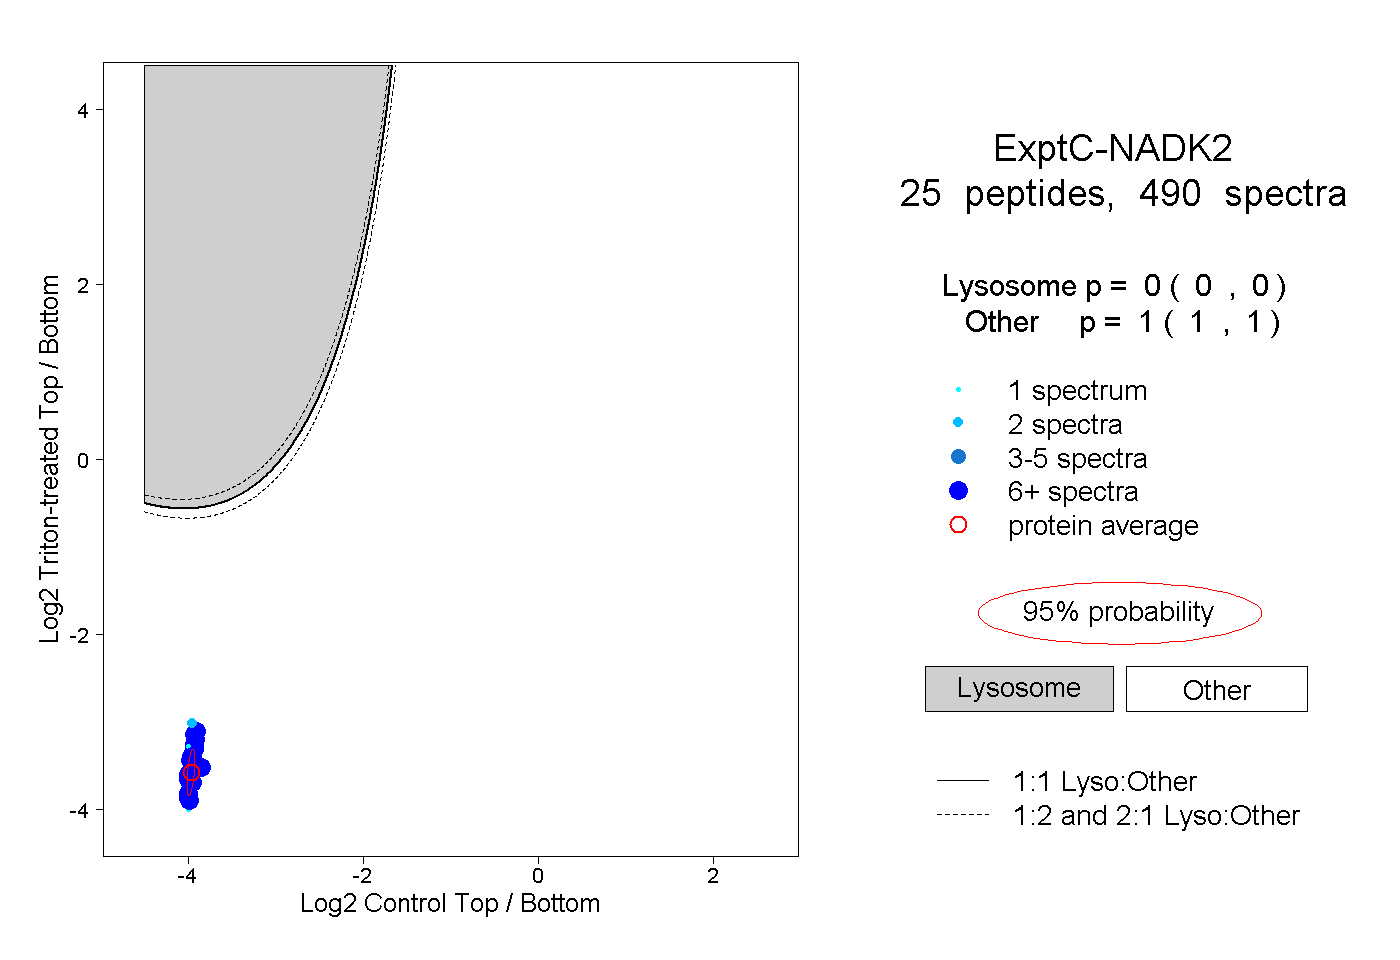
0.000 | 0.000
1.000 | 1.000
16peptides
spectra
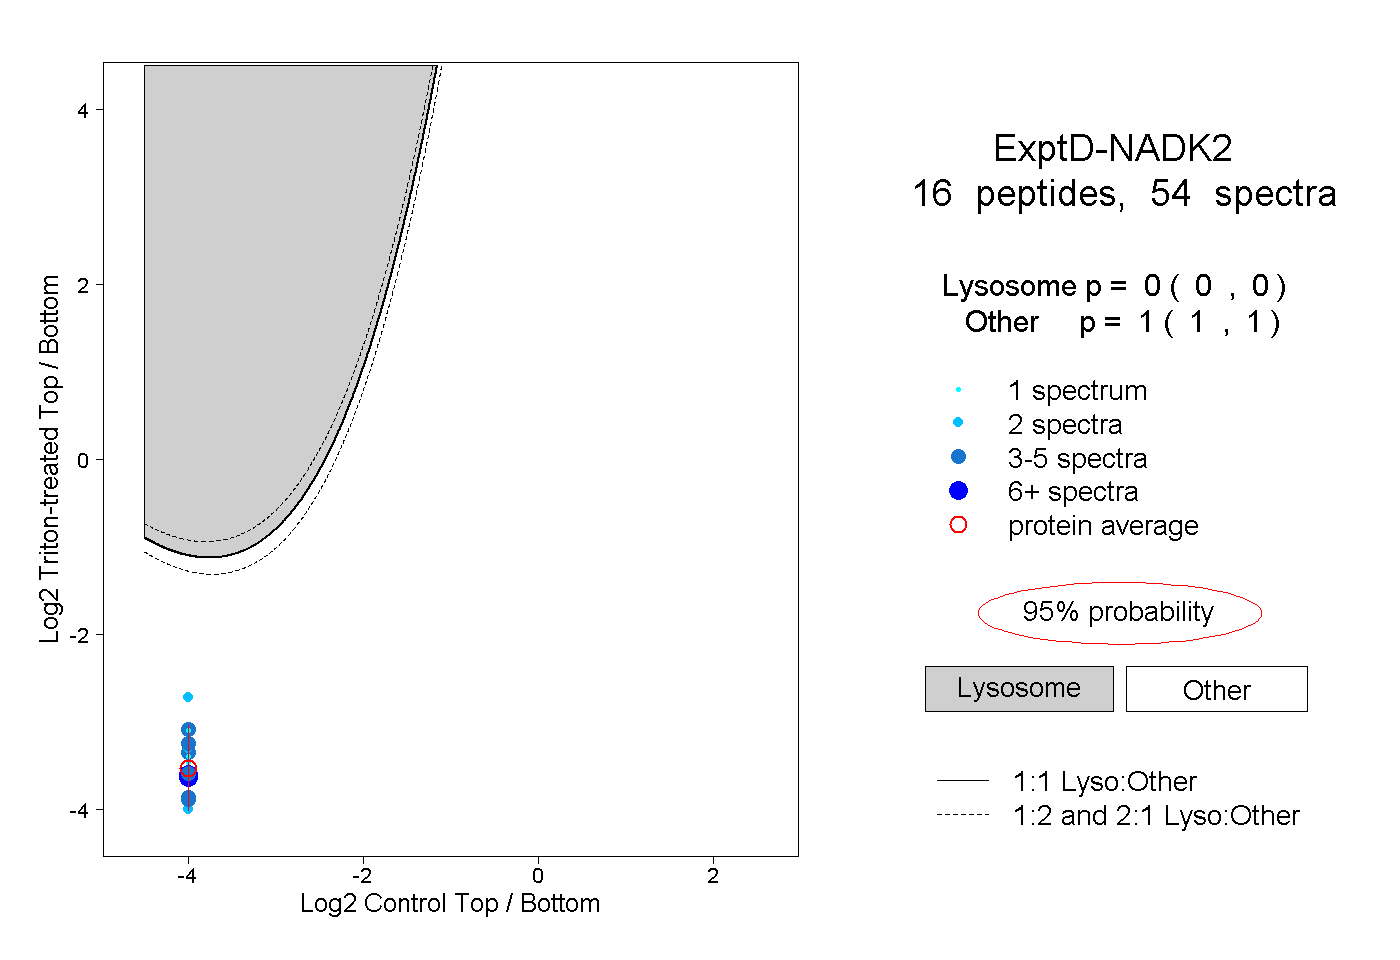
0.000 | 0.000
1.000 | 1.000