 24
24peptides
spectra
0.963 | 0.966
0.000 | 0.000
0.000 | 0.000
0.000 | 0.000
0.000 | 0.000
0.000 | 0.000
0.000 | 0.000
0.034 | 0.037
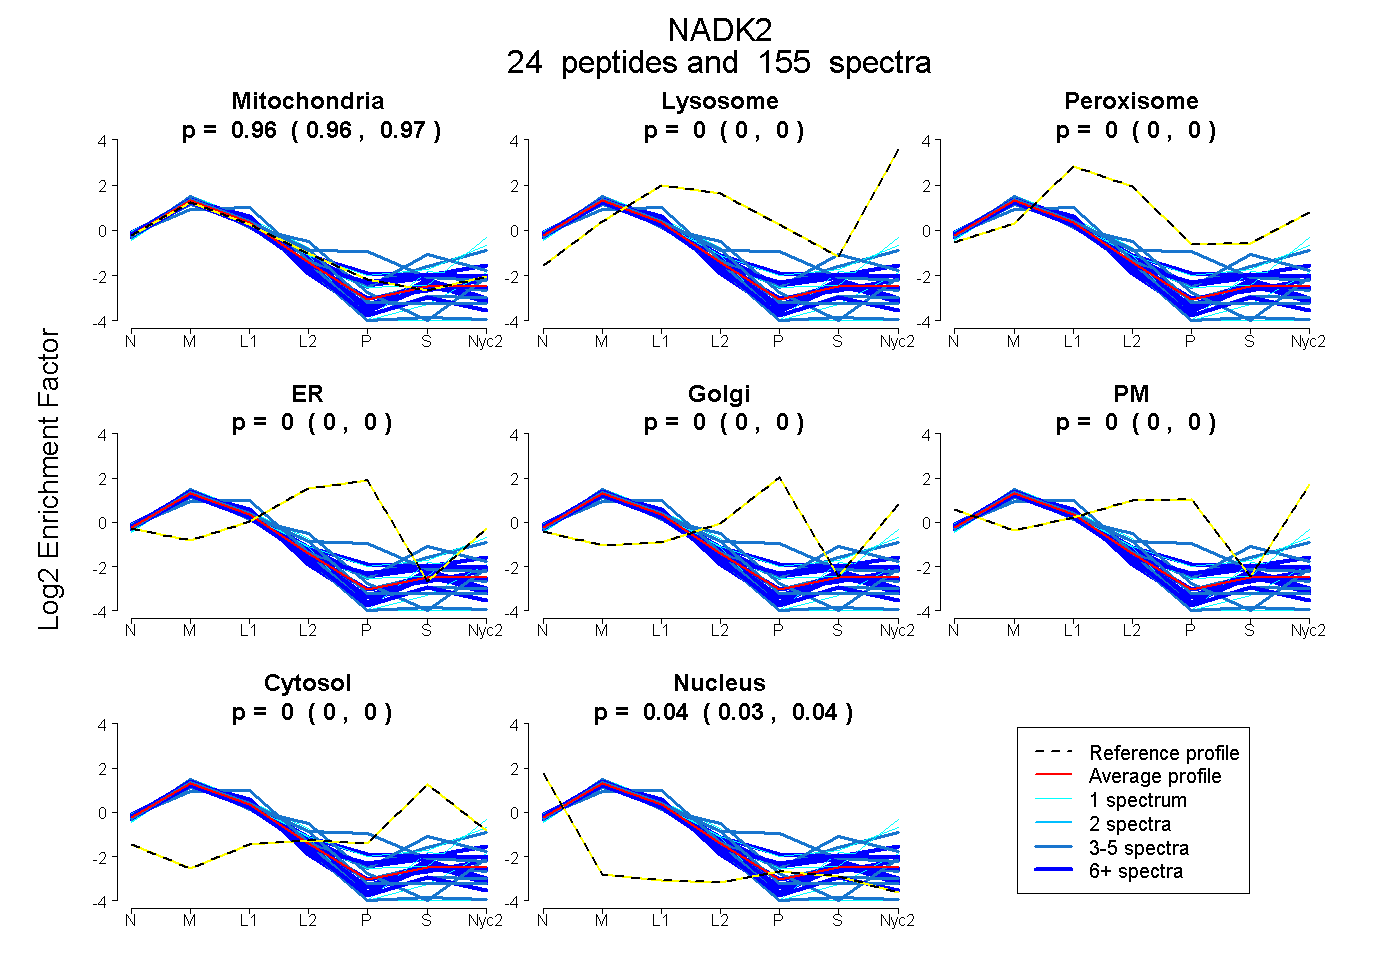
| Plot | Mito | Lyso | Perox | ER | Golgi | PM | Cytosol | Nucleus | |||||
| Expt A |
24 peptides |
155 spectra |
|
0.965 0.963 | 0.966 |
0.000 0.000 | 0.000 |
0.000 0.000 | 0.000 |
0.000 0.000 | 0.000 |
0.000 0.000 | 0.000 |
0.000 0.000 | 0.000 |
0.000 0.000 | 0.000 |
0.035 0.034 | 0.037 |
| 1 spectrum, TVILEQ | 0.786 | 0.168 | 0.000 | 0.000 | 0.000 | 0.000 | 0.000 | 0.046 | ||
| 11 spectra, EYDEETVR | 0.920 | 0.000 | 0.000 | 0.000 | 0.000 | 0.000 | 0.000 | 0.080 | ||
| 19 spectra, ELAGGGSPADGGFRPSR | 0.858 | 0.034 | 0.041 | 0.000 | 0.000 | 0.000 | 0.067 | 0.000 | ||
| 13 spectra, YEFEQQR | 0.913 | 0.000 | 0.000 | 0.000 | 0.000 | 0.000 | 0.087 | 0.000 | ||
| 4 spectra, YTHSFPEALQK | 0.968 | 0.000 | 0.000 | 0.000 | 0.000 | 0.000 | 0.000 | 0.032 | ||
| 1 spectrum, QILALK | 0.947 | 0.000 | 0.000 | 0.000 | 0.000 | 0.000 | 0.040 | 0.013 | ||
| 11 spectra, LIFSLR | 0.973 | 0.000 | 0.000 | 0.000 | 0.000 | 0.000 | 0.000 | 0.027 | ||
| 4 spectra, DEGIEVR | 0.941 | 0.000 | 0.000 | 0.000 | 0.000 | 0.000 | 0.000 | 0.059 | ||
| 3 spectra, WADAVIAAGGDGTMLLAASK | 1.000 | 0.000 | 0.000 | 0.000 | 0.000 | 0.000 | 0.000 | 0.000 | ||
| 1 spectrum, QGNLTLPLNK | 1.000 | 0.000 | 0.000 | 0.000 | 0.000 | 0.000 | 0.000 | 0.000 | ||
| 10 spectra, ALNEVFIGESLSSR | 0.928 | 0.000 | 0.000 | 0.000 | 0.000 | 0.000 | 0.000 | 0.072 | ||
| 4 spectra, SSGLNLCTGTGSK | 0.888 | 0.000 | 0.000 | 0.000 | 0.000 | 0.000 | 0.000 | 0.112 | ||
| 3 spectra, AFNIER | 0.798 | 0.085 | 0.000 | 0.000 | 0.000 | 0.000 | 0.117 | 0.000 | ||
| 10 spectra, SEASGPQLLPVR | 0.937 | 0.000 | 0.000 | 0.000 | 0.000 | 0.000 | 0.000 | 0.063 | ||
| 1 spectrum, NVEHIIDSLR | 0.759 | 0.158 | 0.000 | 0.000 | 0.000 | 0.000 | 0.082 | 0.000 | ||
| 16 spectra, AWSFNINR | 0.945 | 0.000 | 0.000 | 0.000 | 0.000 | 0.000 | 0.000 | 0.055 | ||
| 6 spectra, YAELSEEDLK | 0.906 | 0.000 | 0.000 | 0.000 | 0.000 | 0.000 | 0.000 | 0.094 | ||
| 4 spectra, SEGHLCLPVR | 0.764 | 0.000 | 0.098 | 0.000 | 0.000 | 0.000 | 0.138 | 0.000 | ||
| 8 spectra, EPIANR | 0.930 | 0.000 | 0.000 | 0.000 | 0.000 | 0.000 | 0.000 | 0.070 | ||
| 9 spectra, LKPVIGVNTDPER | 0.945 | 0.000 | 0.000 | 0.000 | 0.000 | 0.000 | 0.055 | 0.000 | ||
| 1 spectrum, ASYYEISVDDGPWEK | 0.958 | 0.000 | 0.000 | 0.000 | 0.000 | 0.000 | 0.000 | 0.042 | ||
| 4 spectra, VFSSSR | 0.810 | 0.000 | 0.000 | 0.163 | 0.000 | 0.000 | 0.027 | 0.000 | ||
| 5 spectra, VAAQAVEDVLNIAR | 0.938 | 0.000 | 0.000 | 0.000 | 0.000 | 0.000 | 0.000 | 0.062 | ||
| 6 spectra, GSSYSGLLER | 0.926 | 0.000 | 0.000 | 0.000 | 0.000 | 0.000 | 0.000 | 0.074 |
| Plot | Mito | Lyso or Perox | ER | Golgi | PM | Cytosol | Nucleus | ||||||
| Expt B |
21 peptides |
95 spectra |
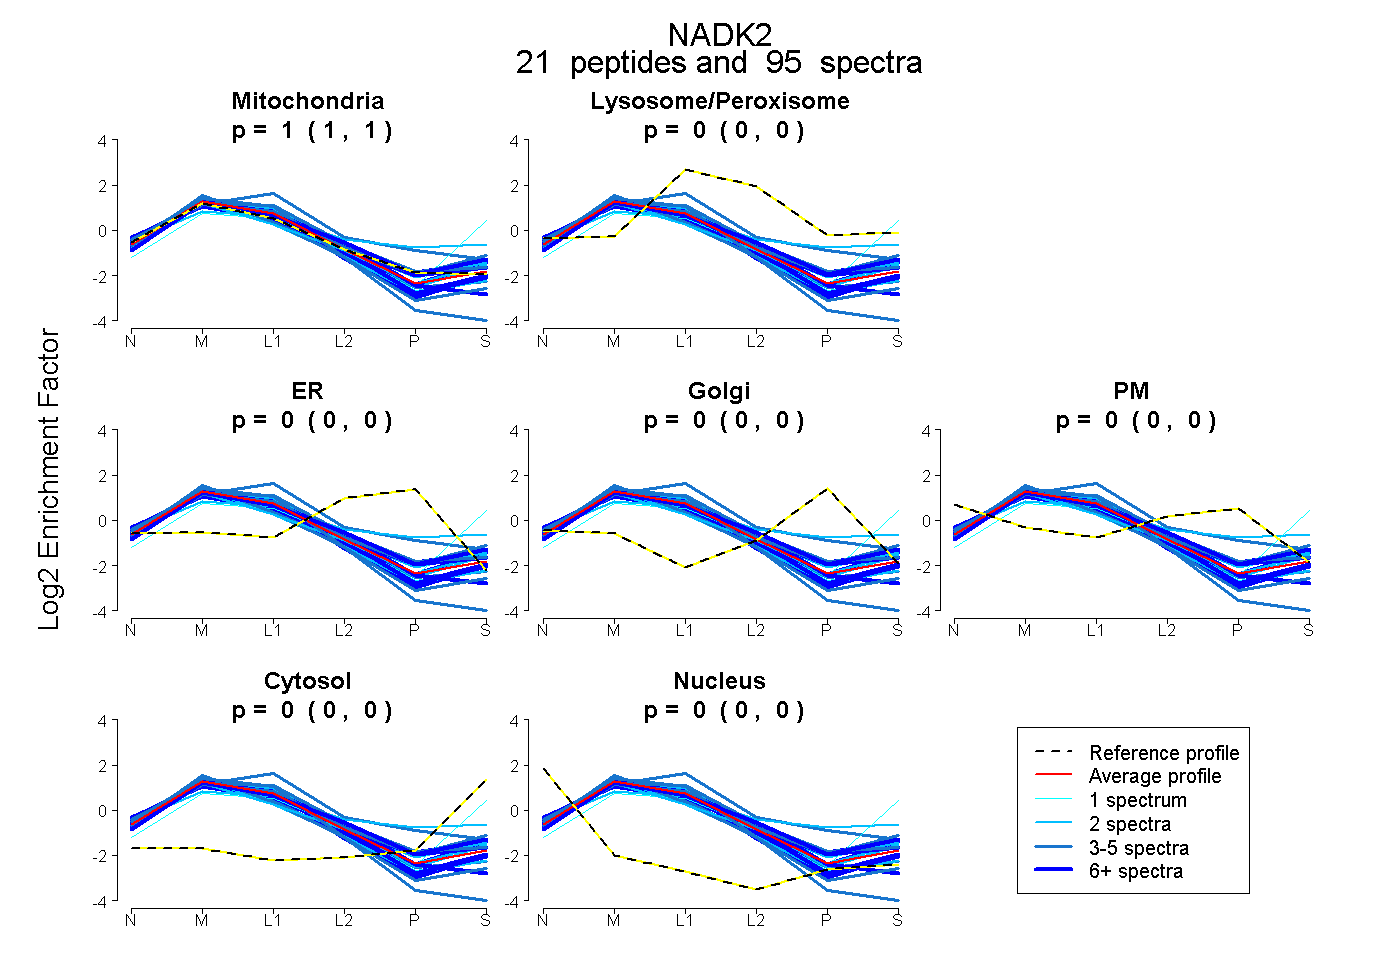 |
1.000 1.000 | 1.000 |
0.000 0.000 | 0.000 |
0.000 0.000 | 0.000 |
0.000 0.000 | 0.000 |
0.000 0.000 | 0.000 |
0.000 0.000 | 0.000 |
0.000 0.000 | 0.000 |
|||
| Plot | Lyso | Other | |||||||||||
| Expt C |
25 peptides |
490 spectra |
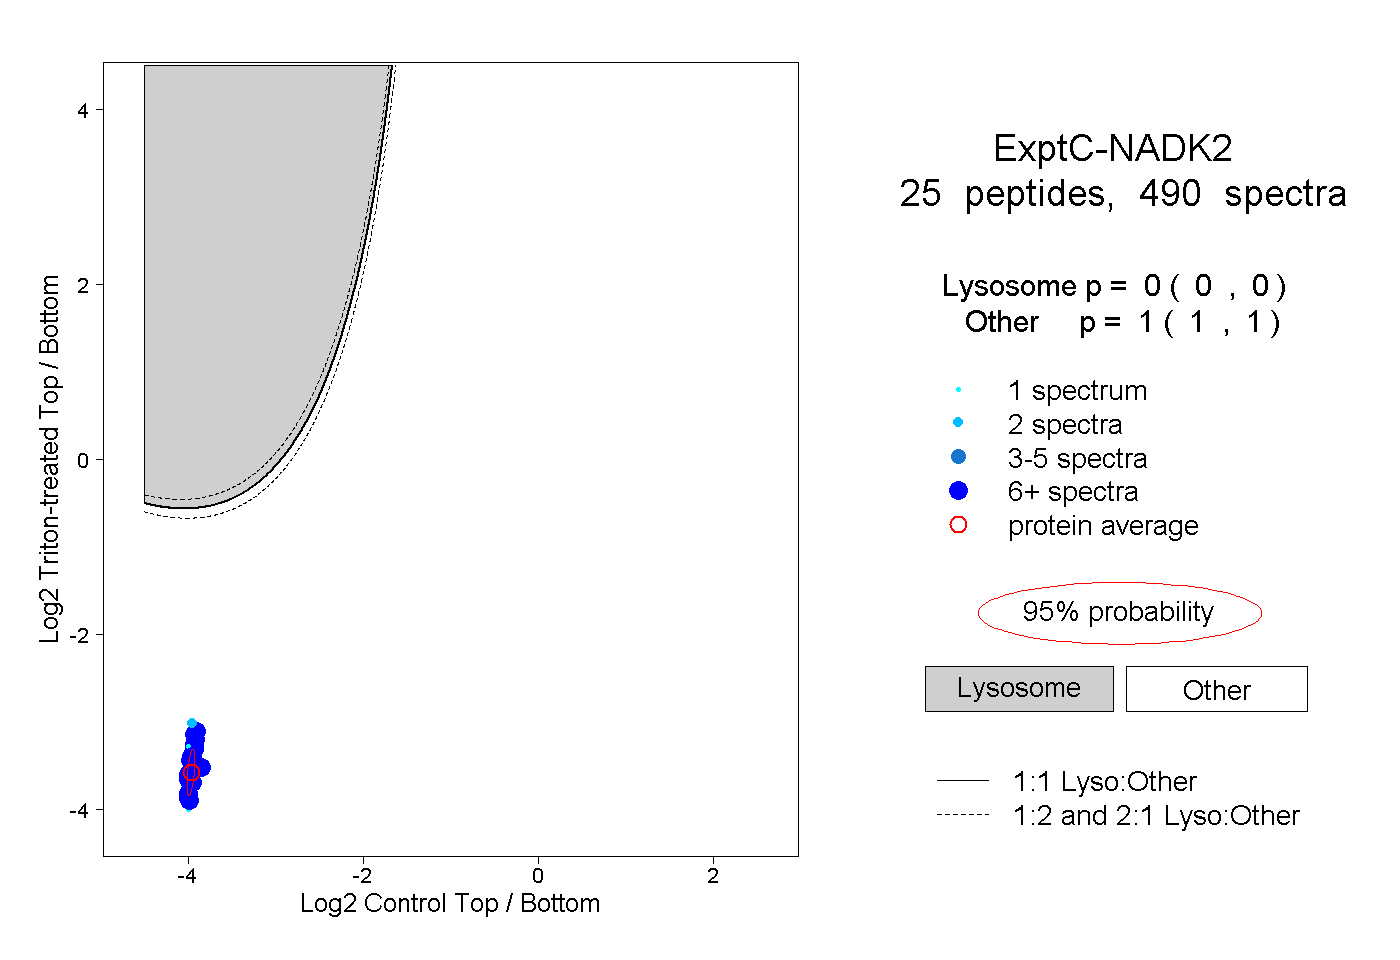 |
0.000 0.000 | 0.000 |
1.000 1.000 | 1.000 |
||||||||
| Plot | Lyso | Other | |||||||||||
| Expt D |
16 peptides |
54 spectra |
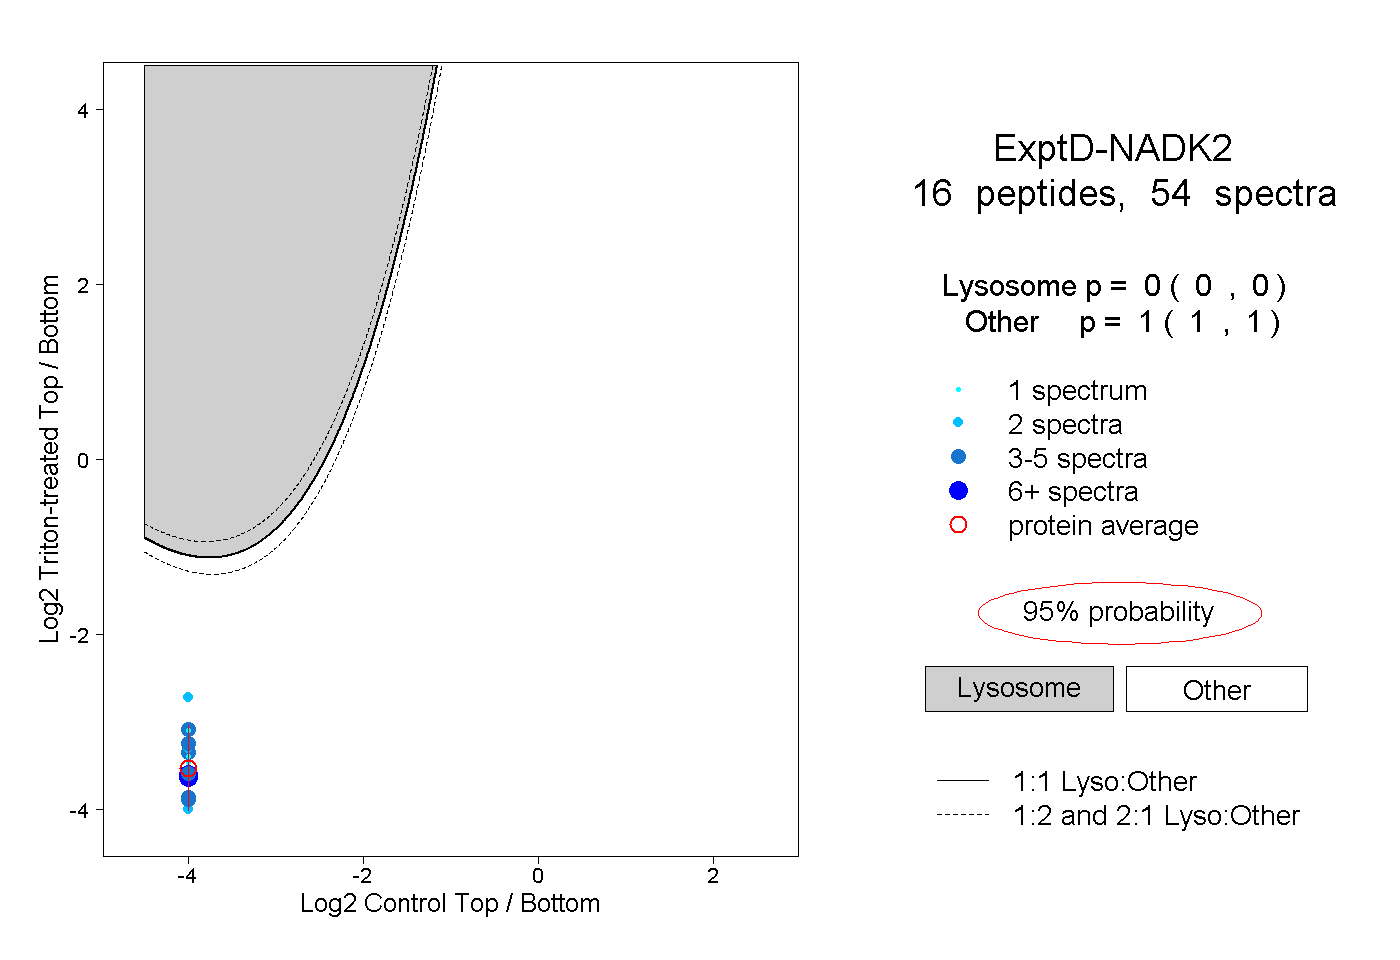 |
0.000 0.000 | 0.000 |
1.000 1.000 | 1.000 |