 9
9peptides
spectra
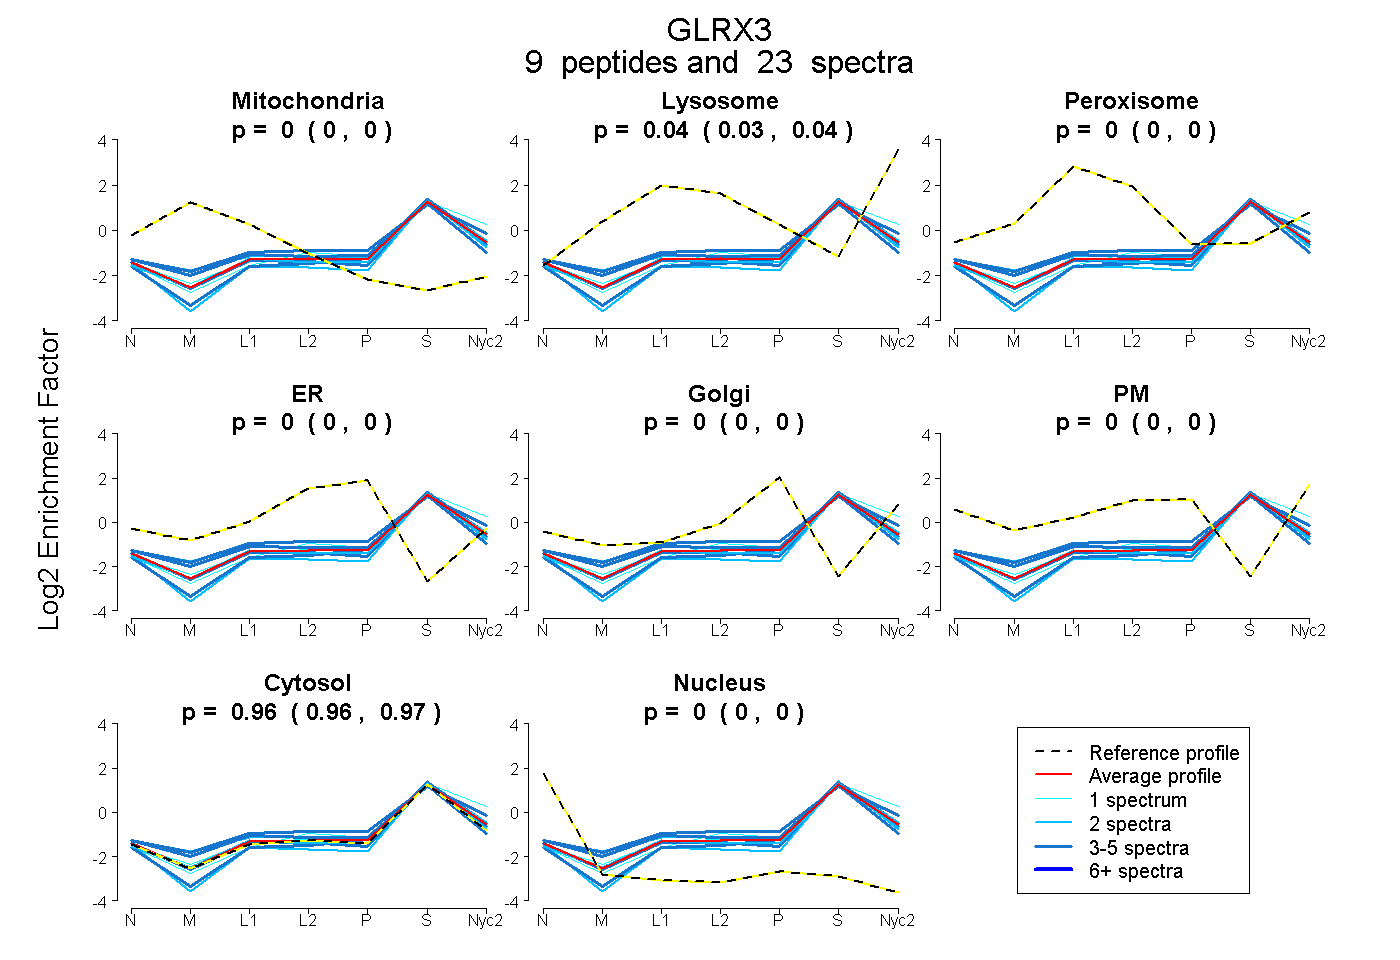
0.000 | 0.000
0.030 | 0.042
0.000 | 0.000
0.000 | 0.000
0.000 | 0.000
0.000 | 0.000
0.956 | 0.969
0.000 | 0.000
3peptides
spectra
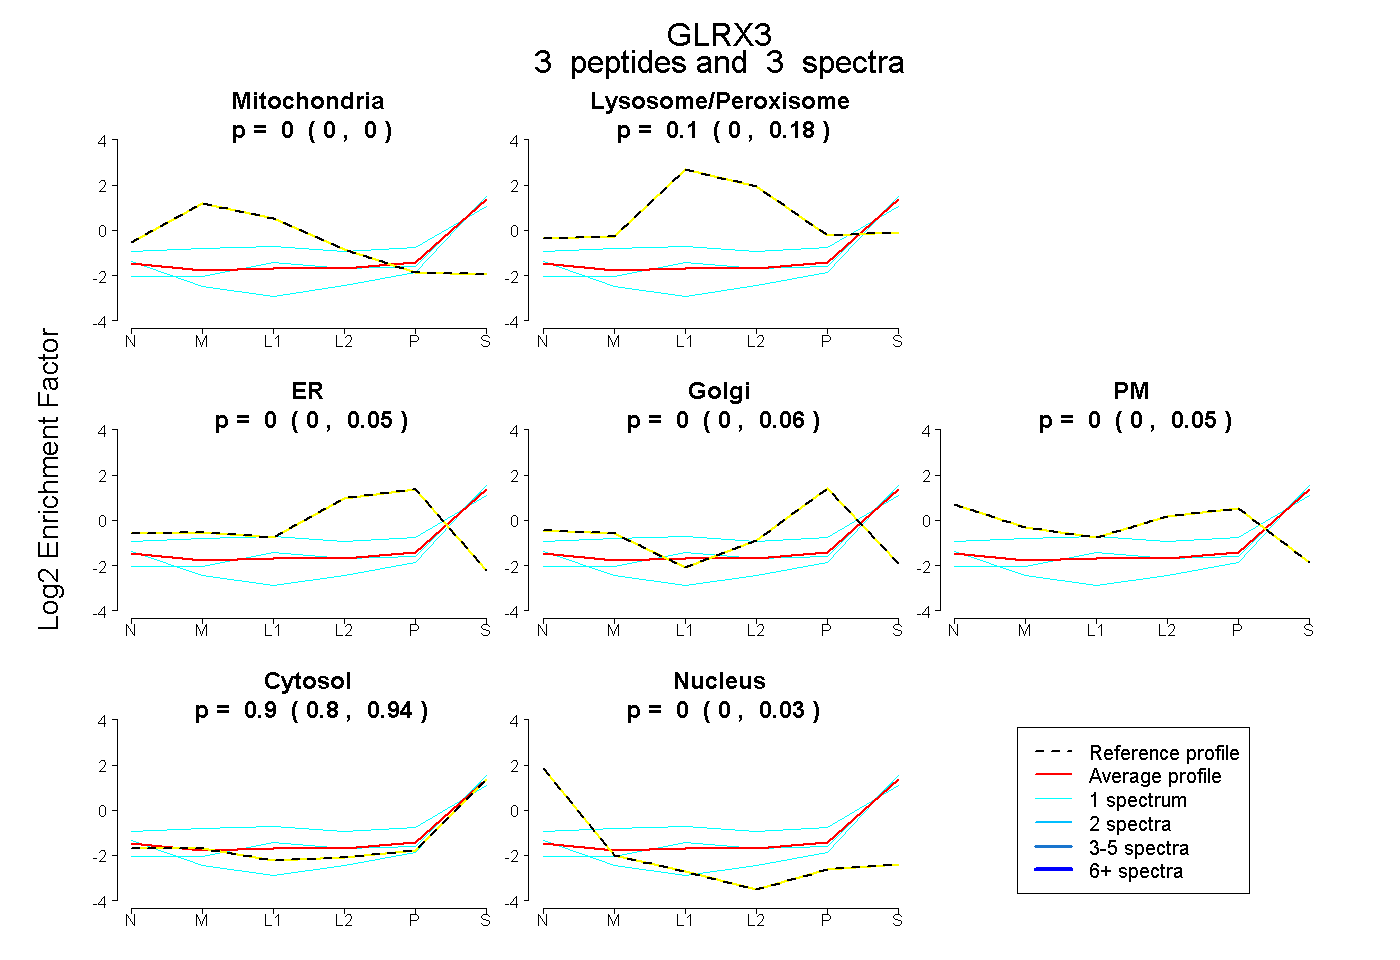
0.000 | 0.000
0.000 | 0.177
0.000 | 0.051
0.000 | 0.056
0.000 | 0.049
0.797 | 0.940
0.000 | 0.034
8peptides
spectra
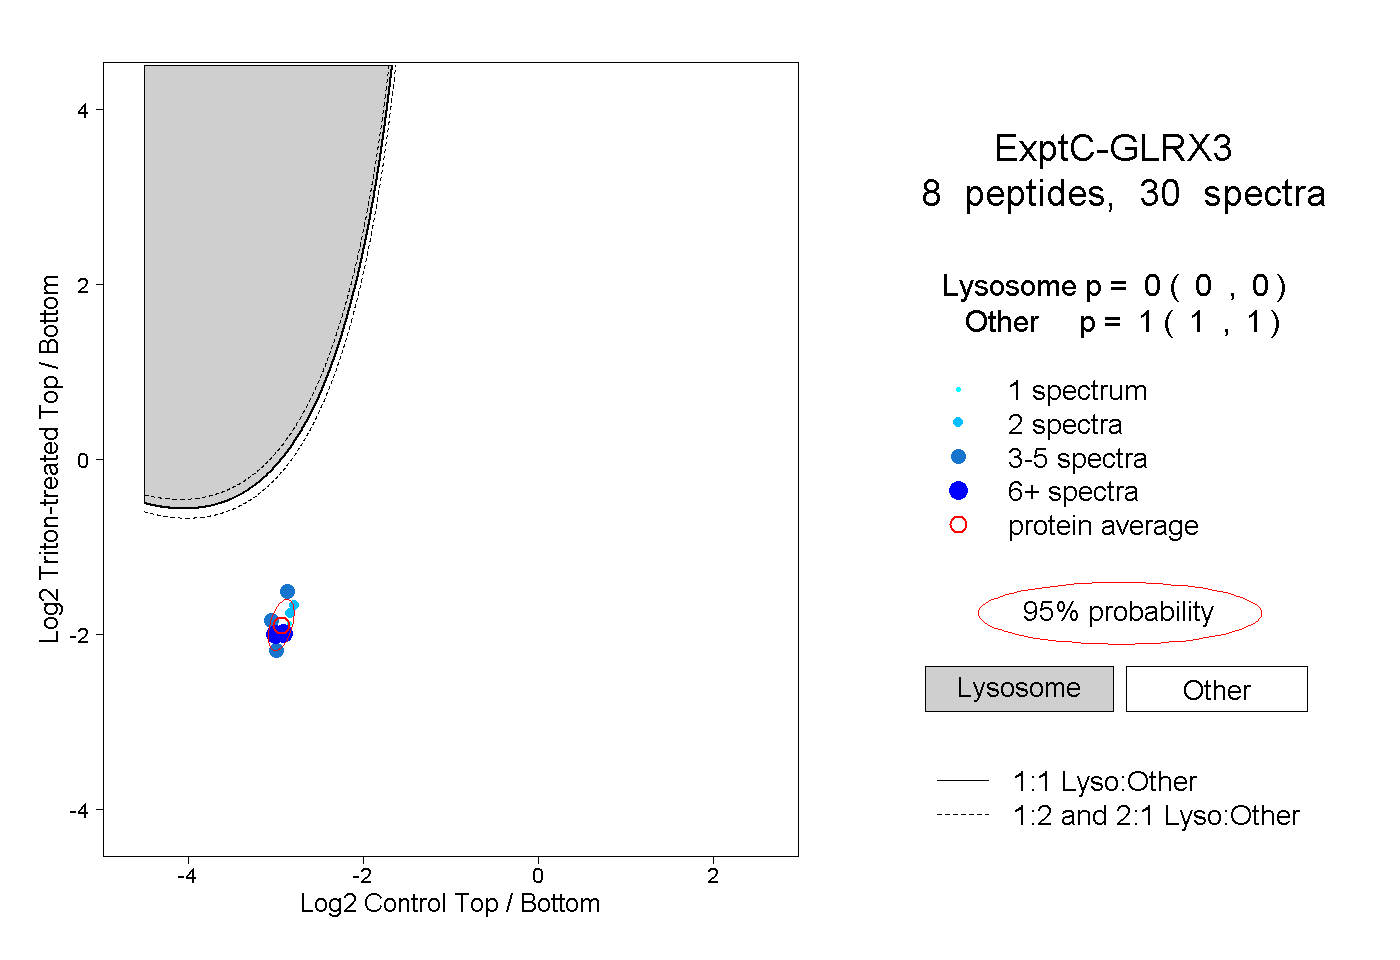
0.000 | 0.000
1.000 | 1.000
1peptide
spectra
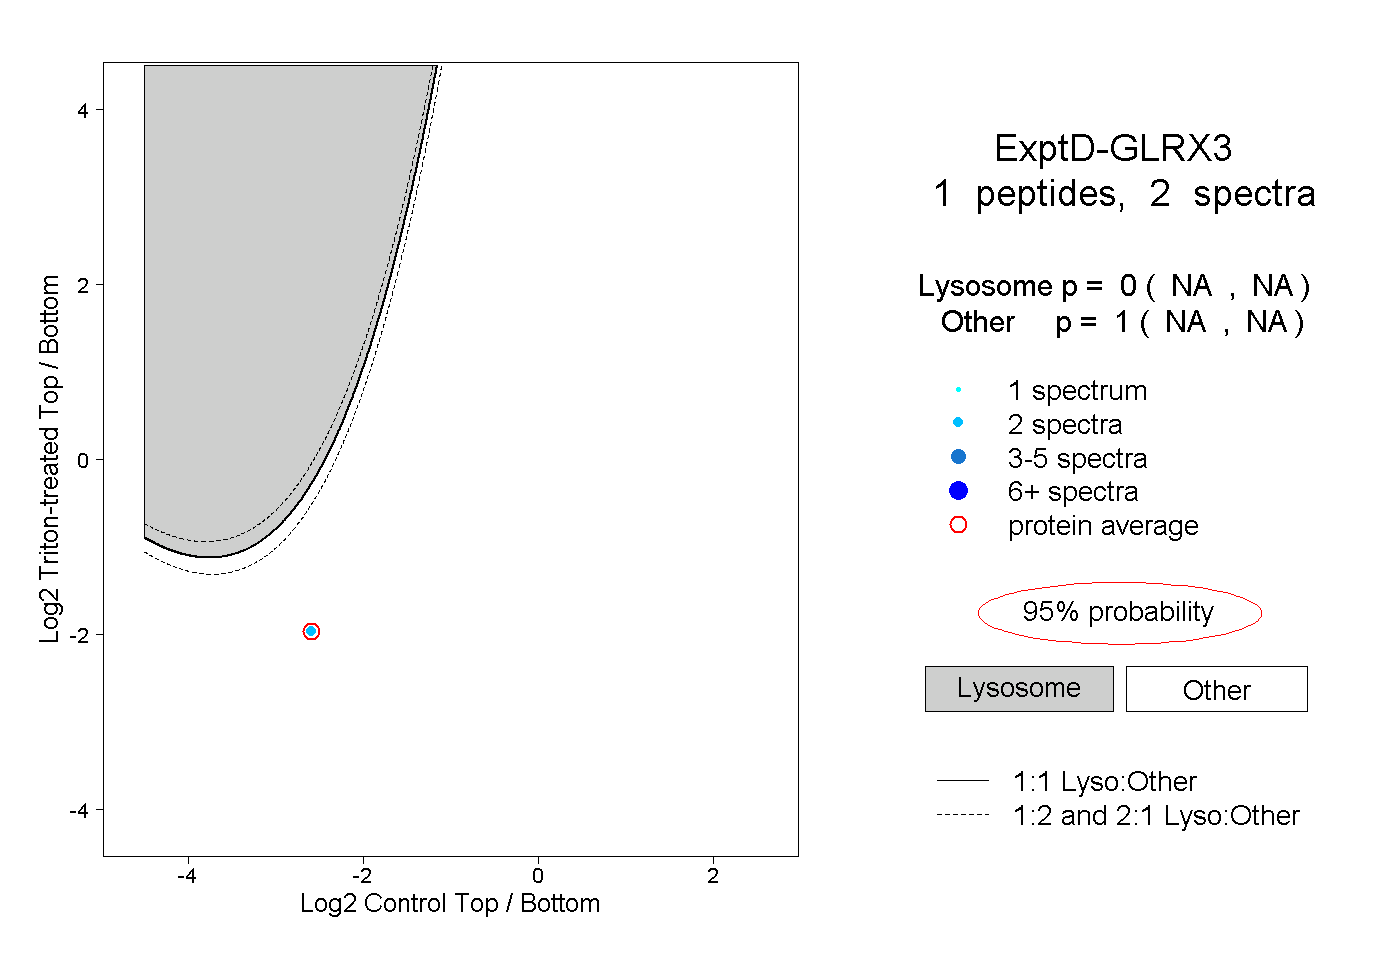
NA | NA
NA | NA