 9
9peptides
spectra
0.000 | 0.000
0.030 | 0.042
0.000 | 0.000
0.000 | 0.000
0.000 | 0.000
0.000 | 0.000
0.956 | 0.969
0.000 | 0.000
| Plot | Mito | Lyso | Perox | ER | Golgi | PM | Cytosol | Nucleus | |||||
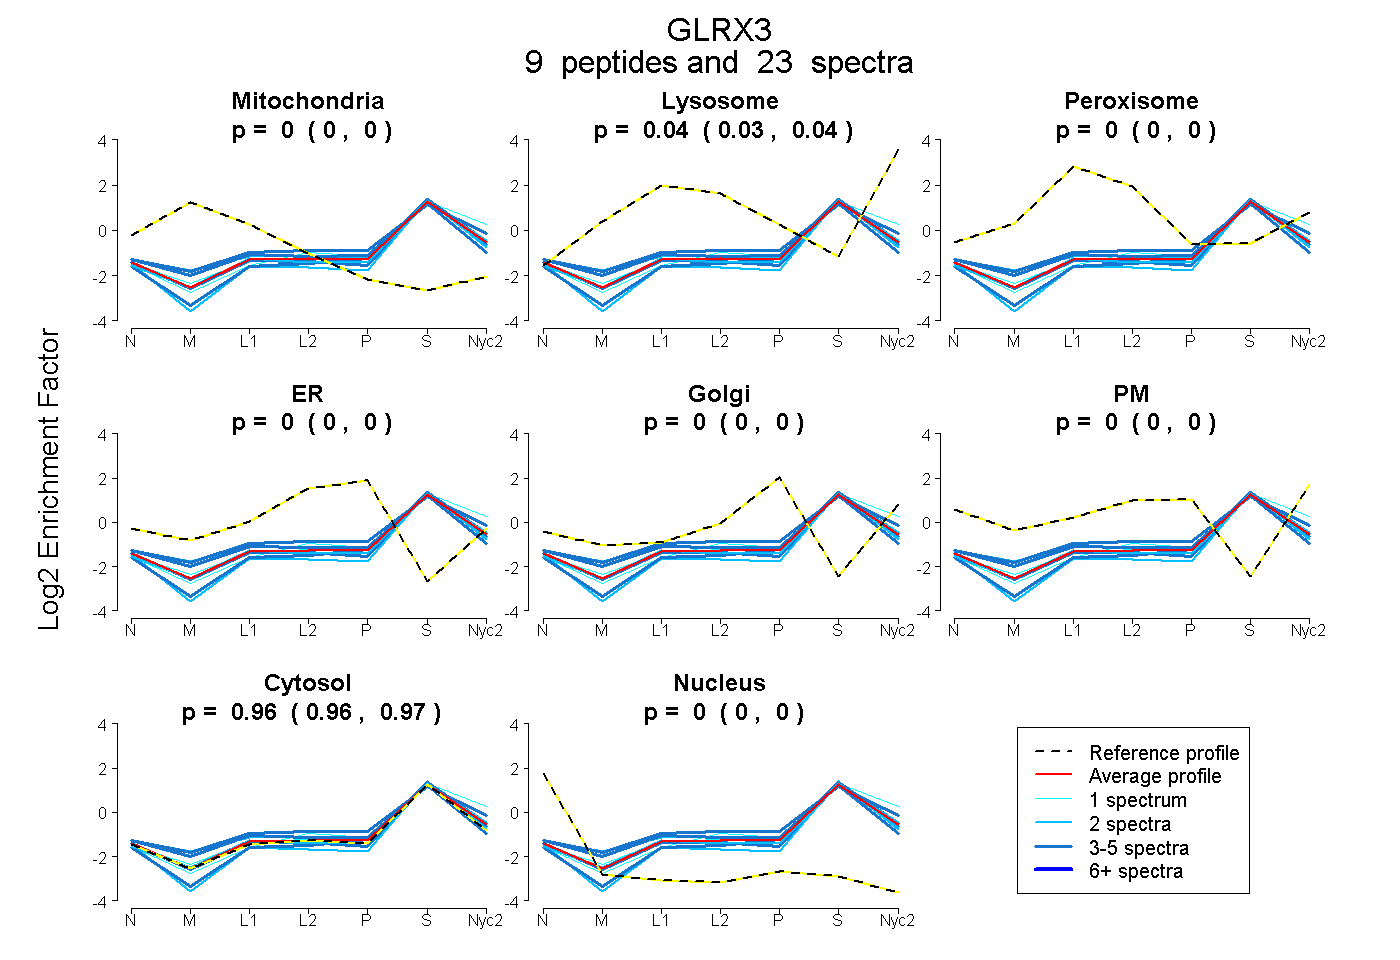
| Expt A |
9 peptides |
23 spectra |
|
0.000 0.000 | 0.000 |
0.037 0.030 | 0.042 |
0.000 0.000 | 0.000 |
0.000 0.000 | 0.000 |
0.000 0.000 | 0.000 |
0.000 0.000 | 0.000 |
0.963 0.956 | 0.969 |
0.000 0.000 | 0.000 |
| 1 spectrum, DNGELLPILK | 0.000 | 0.025 | 0.000 | 0.000 | 0.009 | 0.000 | 0.966 | 0.000 | ||
| 2 spectra, HNIQFSSFDIFSDEEVR | 0.039 | 0.086 | 0.000 | 0.000 | 0.000 | 0.000 | 0.875 | 0.000 | ||
| 4 spectra, EDLNLR | 0.000 | 0.009 | 0.000 | 0.000 | 0.000 | 0.000 | 0.991 | 0.000 | ||
| 2 spectra, GDLVGGLDIVK | 0.000 | 0.000 | 0.000 | 0.000 | 0.000 | 0.000 | 0.977 | 0.023 | ||
| 3 spectra, LTHAAPCMLFMK | 0.042 | 0.000 | 0.060 | 0.007 | 0.000 | 0.000 | 0.892 | 0.000 | ||
| 2 spectra, LDGAHAPELTK | 0.000 | 0.009 | 0.000 | 0.000 | 0.000 | 0.000 | 0.991 | 0.000 | ||
| 4 spectra, QMVEILHK | 0.000 | 0.142 | 0.010 | 0.000 | 0.016 | 0.000 | 0.833 | 0.000 | ||
| 1 spectrum, ASVMLFMK | 0.000 | 0.104 | 0.000 | 0.000 | 0.000 | 0.000 | 0.896 | 0.000 | ||
| 4 spectra, GTPQEPR | 0.000 | 0.000 | 0.000 | 0.000 | 0.000 | 0.000 | 1.000 | 0.000 |
| Plot | Mito | Lyso or Perox | ER | Golgi | PM | Cytosol | Nucleus | ||||||
| Expt B |
3 peptides |
3 spectra |
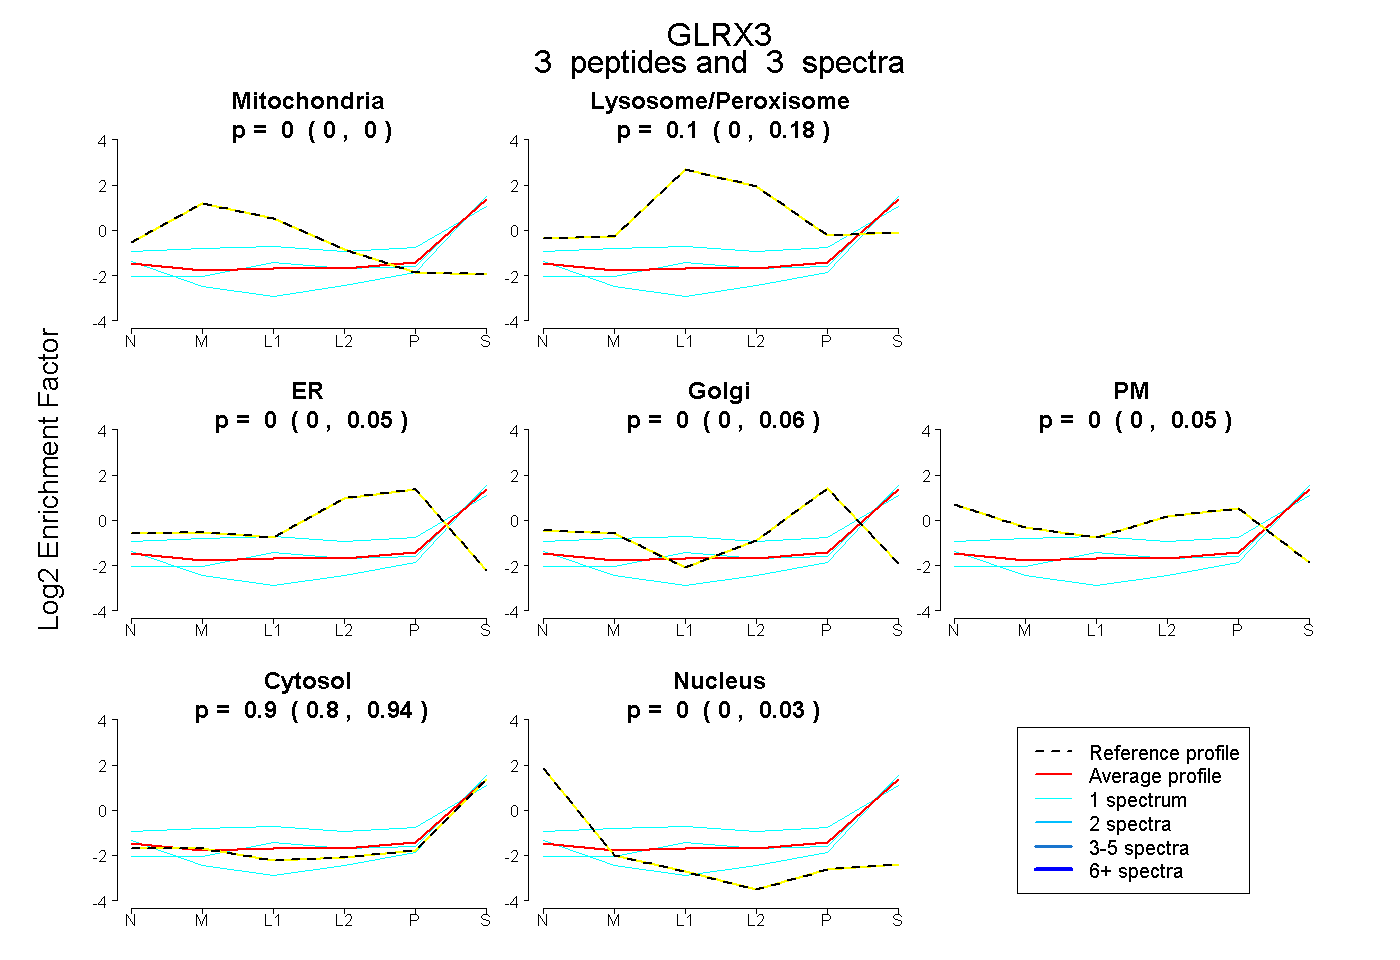 |
0.000 0.000 | 0.000 |
0.105 0.000 | 0.177 |
0.000 0.000 | 0.051 |
0.000 0.000 | 0.056 |
0.000 0.000 | 0.049 |
0.895 0.797 | 0.940 |
0.000 0.000 | 0.034 |
|||
| Plot | Lyso | Other | |||||||||||
| Expt C |
8 peptides |
30 spectra |
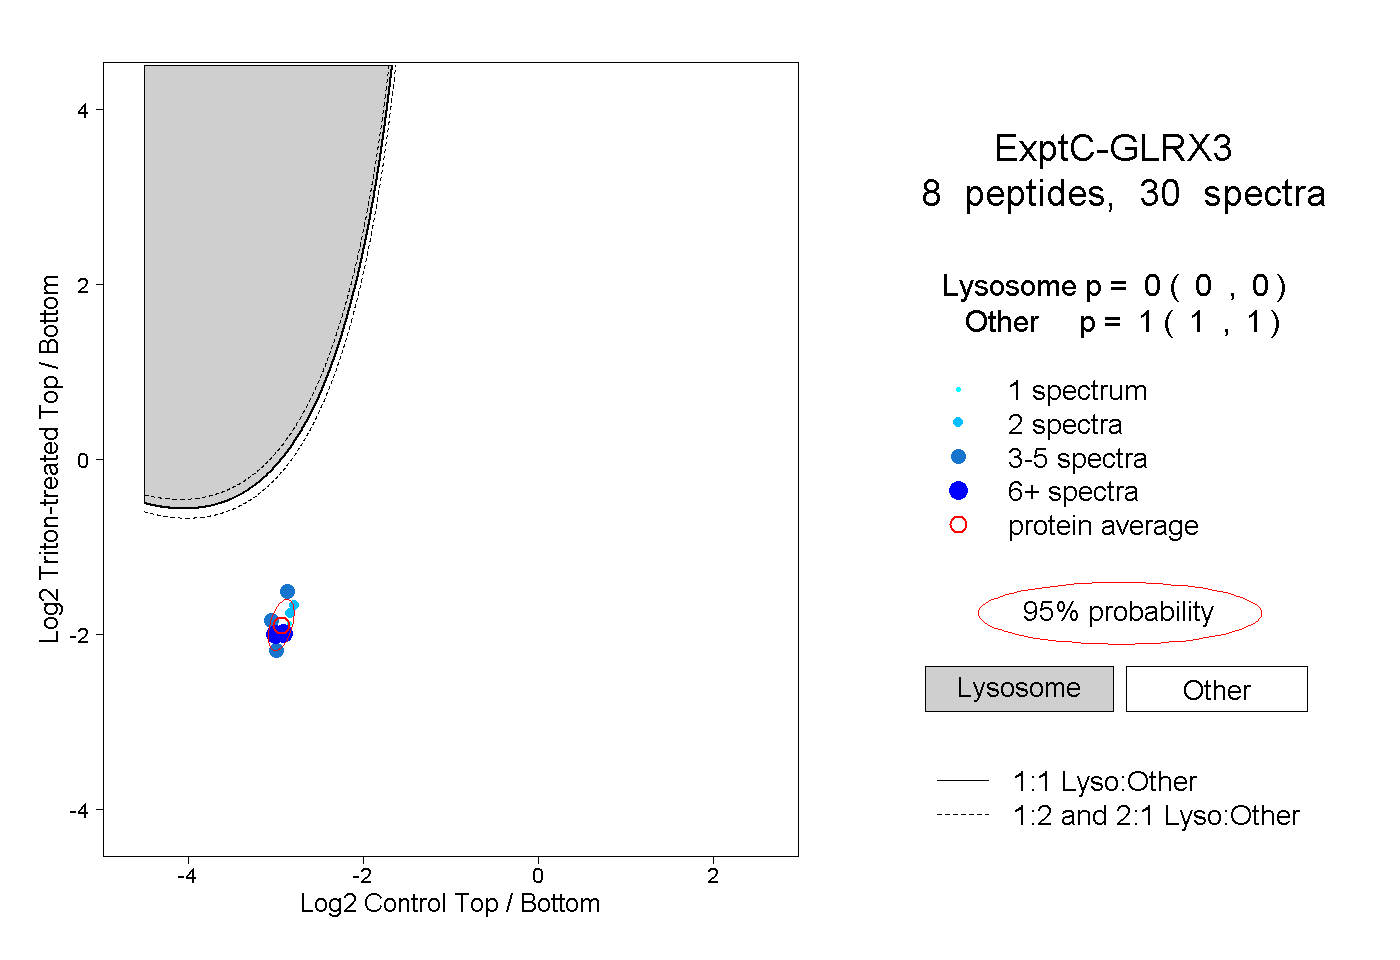 |
0.000 0.000 | 0.000 |
1.000 1.000 | 1.000 |
||||||||
| Plot | Lyso | Other | |||||||||||
| Expt D |
1 peptide |
2 spectra |
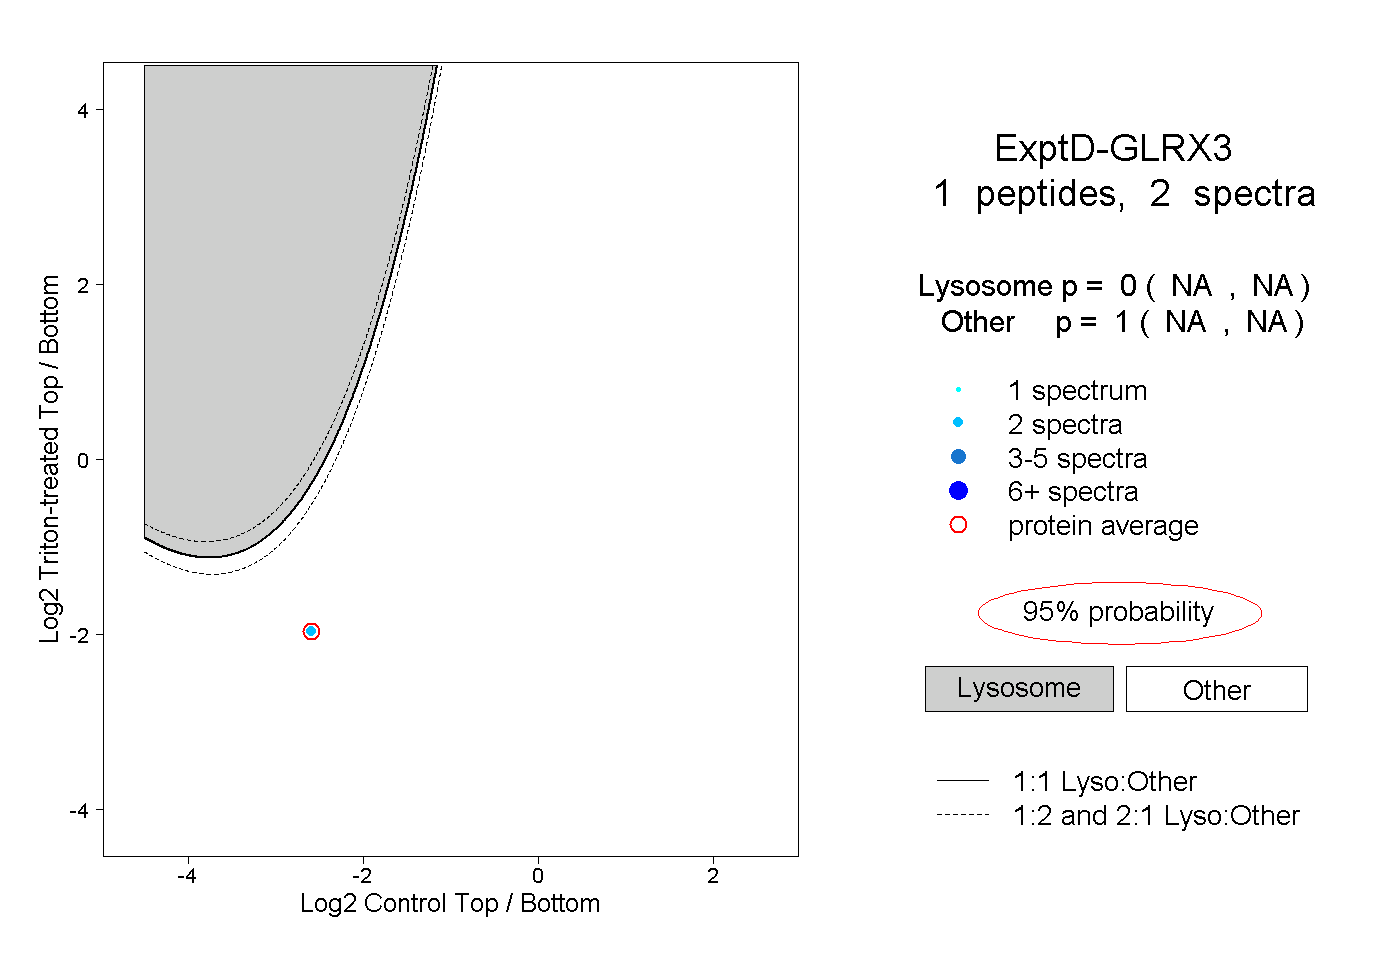 |
0.000 NA | NA |
1.000 NA | NA |