 3
3peptides
spectra
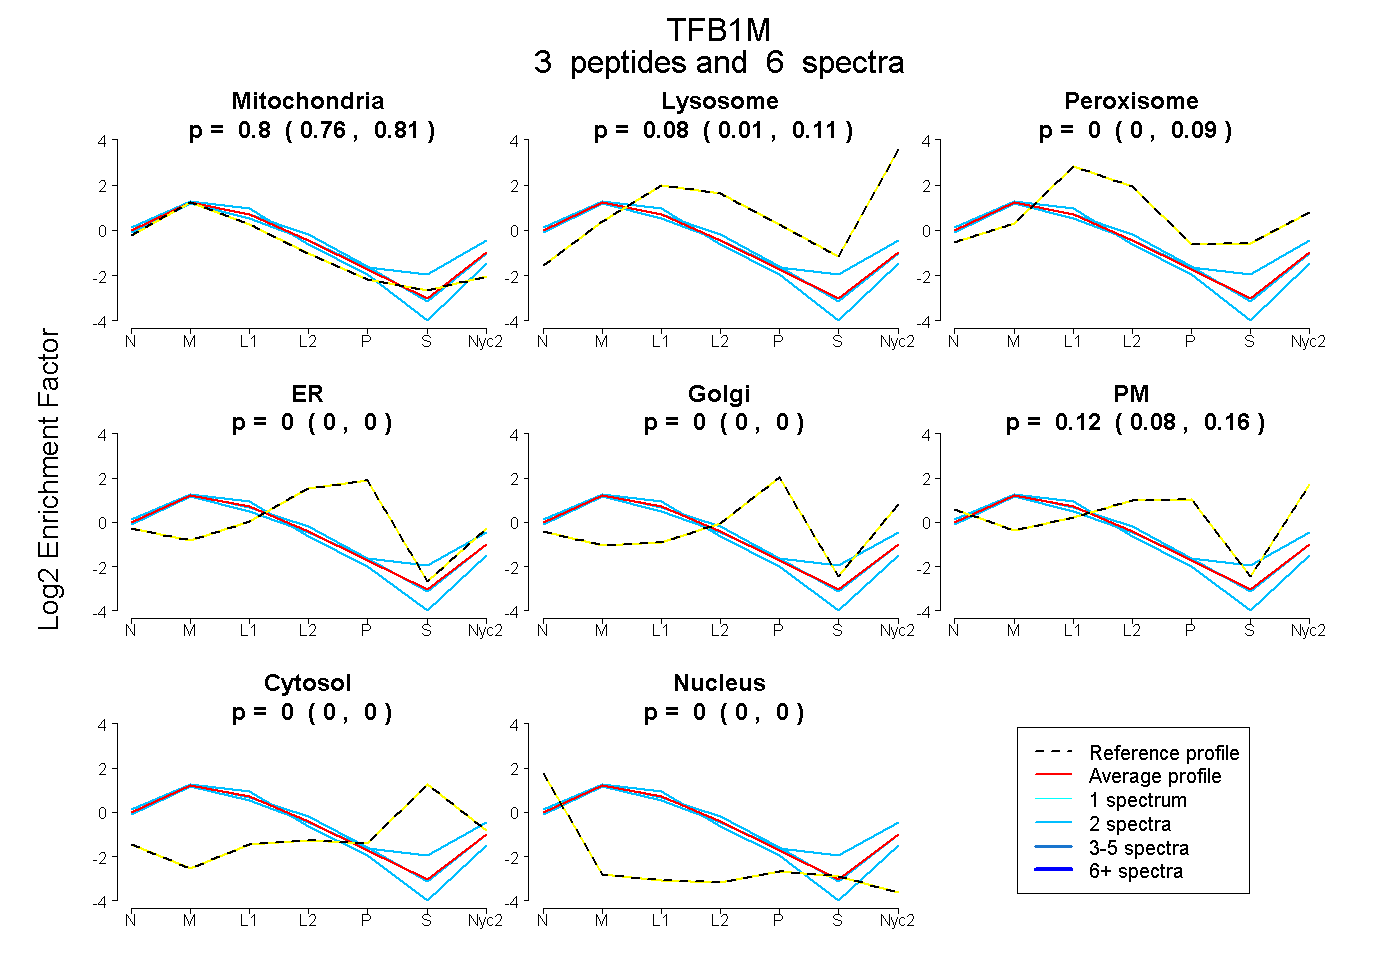
0.759 | 0.813
0.009 | 0.109
0.000 | 0.085
0.000 | 0.000
0.000 | 0.000
0.076 | 0.165
0.000 | 0.000
0.000 | 0.000
9peptides
spectra
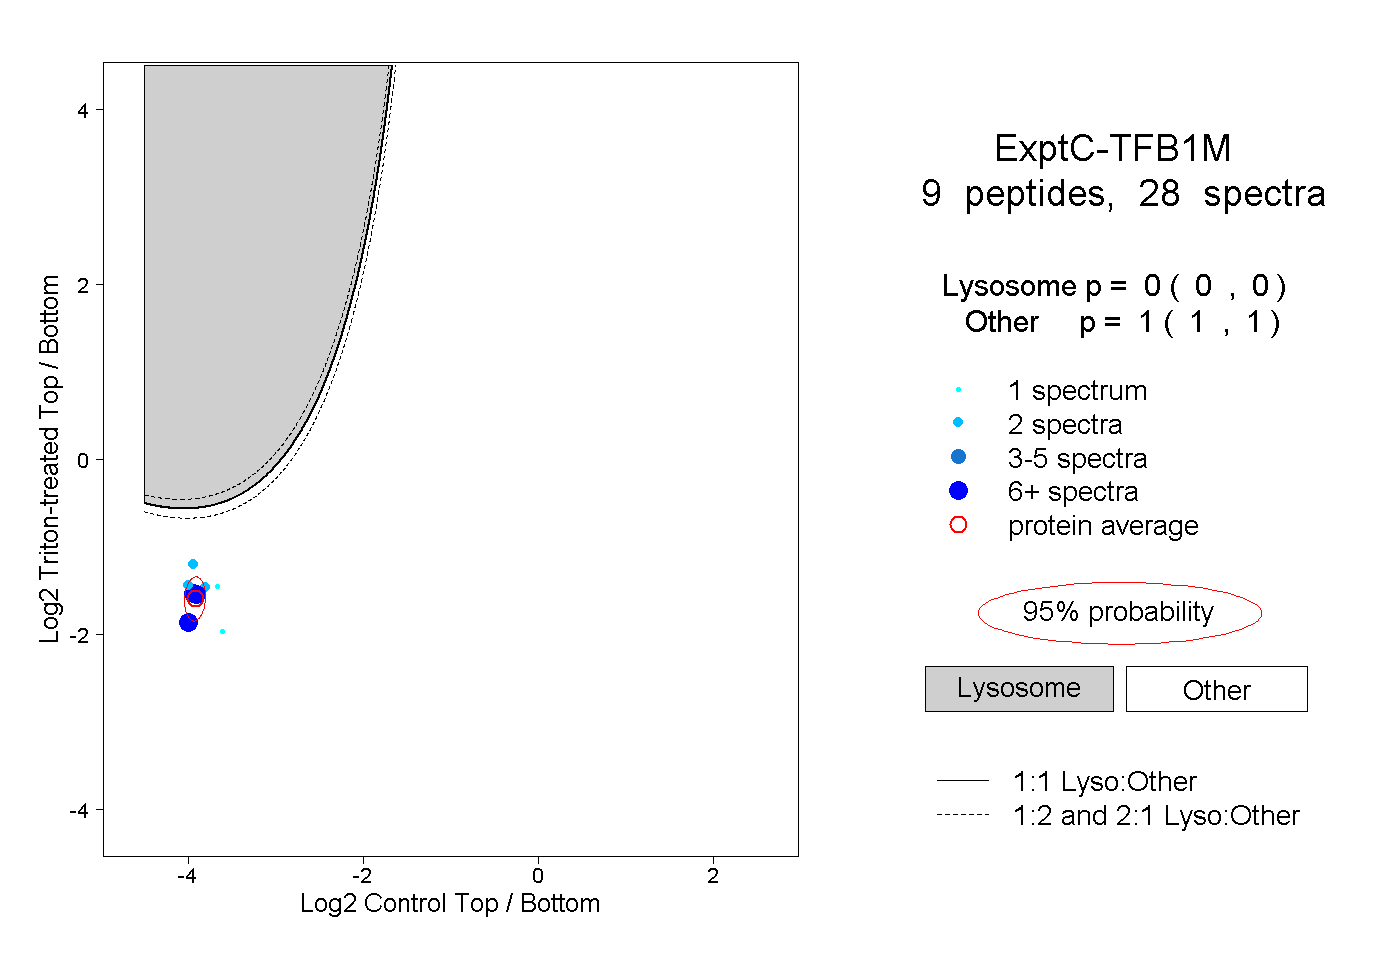
0.000 | 0.000
1.000 | 1.000
2peptides
spectra
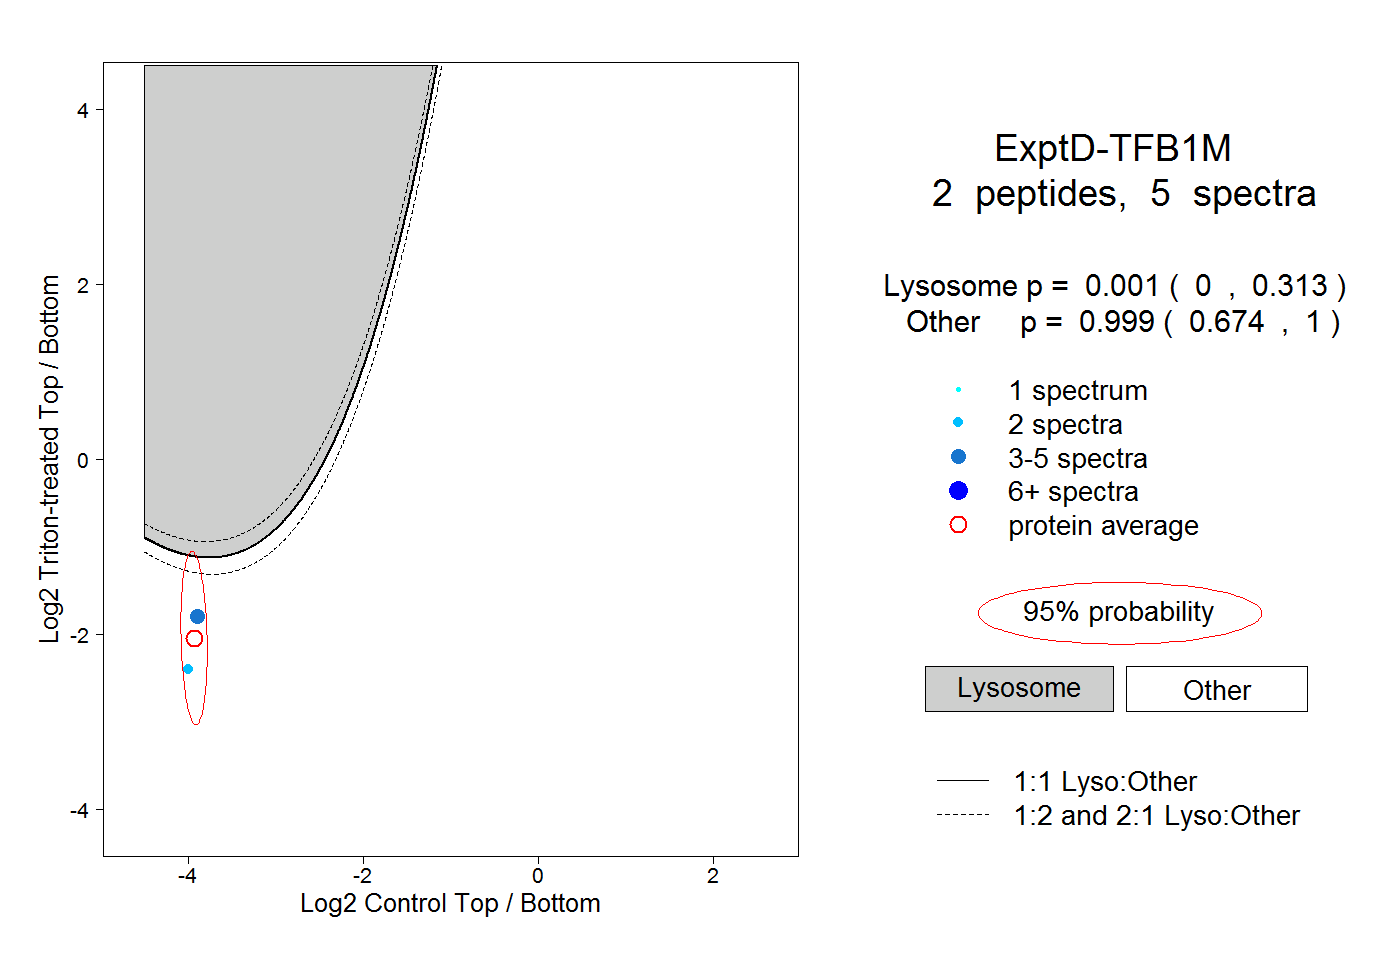
0.000 | 0.313
0.674 | 1.000