 3
3peptides
spectra
0.759 | 0.813
0.009 | 0.109
0.000 | 0.085
0.000 | 0.000
0.000 | 0.000
0.076 | 0.165
0.000 | 0.000
0.000 | 0.000
9peptides
spectra
0.000 | 0.000
1.000 | 1.000
| Plot | Mito | Lyso | Perox | ER | Golgi | PM | Cytosol | Nucleus | |||||
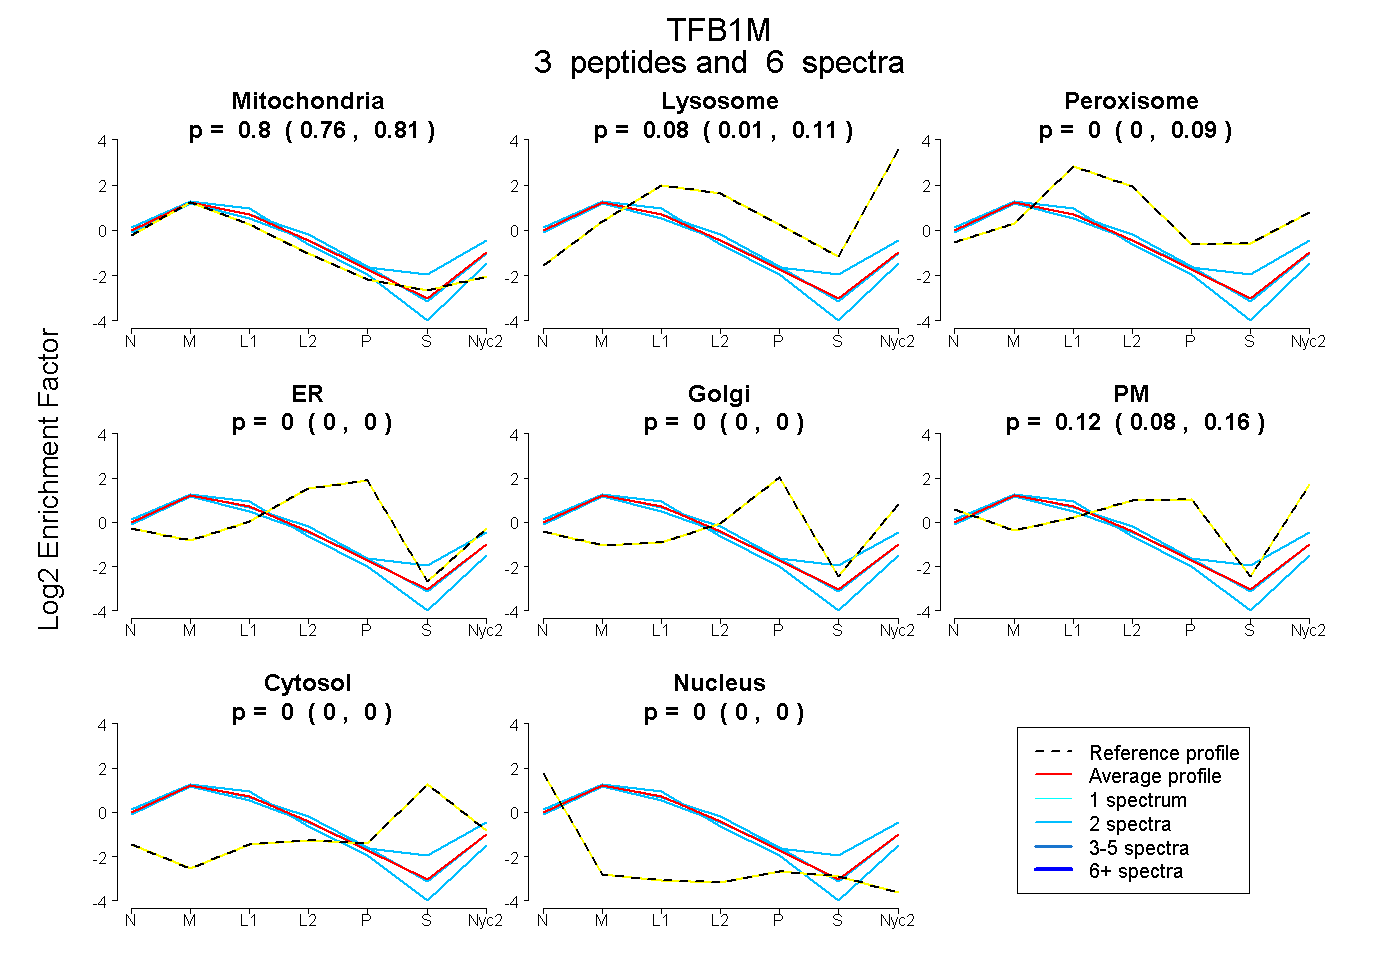
| Expt A |
3 peptides |
6 spectra |
|
0.796 0.759 | 0.813 |
0.078 0.009 | 0.109 |
0.002 0.000 | 0.085 |
0.000 0.000 | 0.000 |
0.000 0.000 | 0.000 |
0.123 0.076 | 0.165 |
0.000 0.000 | 0.000 |
0.000 0.000 | 0.000 |
||
| Plot | Lyso | Other | |||||||||||
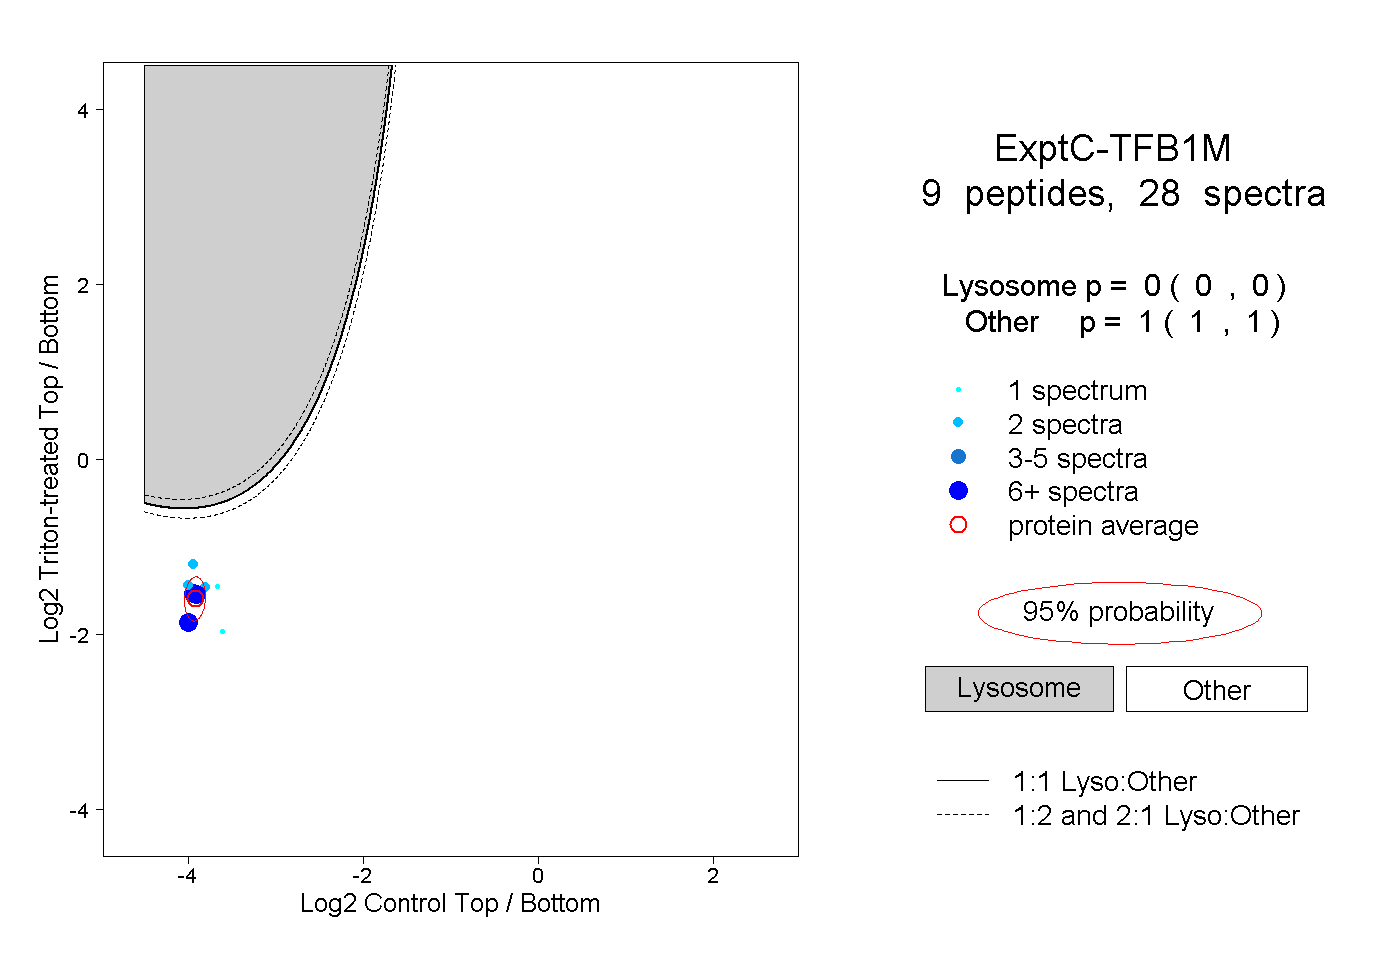
| Expt C |
9 peptides |
28 spectra |
|
0.000 0.000 | 0.000 |
1.000 1.000 | 1.000 |
| 2 spectra, VVQNVFQFR | 0.000 | 1.000 | ||||||||
| 1 spectrum, AFPDNIR | 0.000 | 1.000 | ||||||||
| 2 spectra, QLSQNFLLDLR | 0.000 | 1.000 | ||||||||
| 1 spectrum, MTLTFQK | 0.000 | 1.000 | ||||||||
| 6 spectra, LVATTGSK | 0.000 | 1.000 | ||||||||
| 1 spectrum, GLGMLFPEAQR | 0.000 | 1.000 | ||||||||
| 7 spectra, LPPLPTIR | 0.000 | 1.000 | ||||||||
| 2 spectra, WLENISLK | 0.000 | 1.000 | ||||||||
| 6 spectra, SLCDVYR | 0.000 | 1.000 |
| Plot | Lyso | Other | |||||||||||
| Expt D |
2 peptides |
5 spectra |
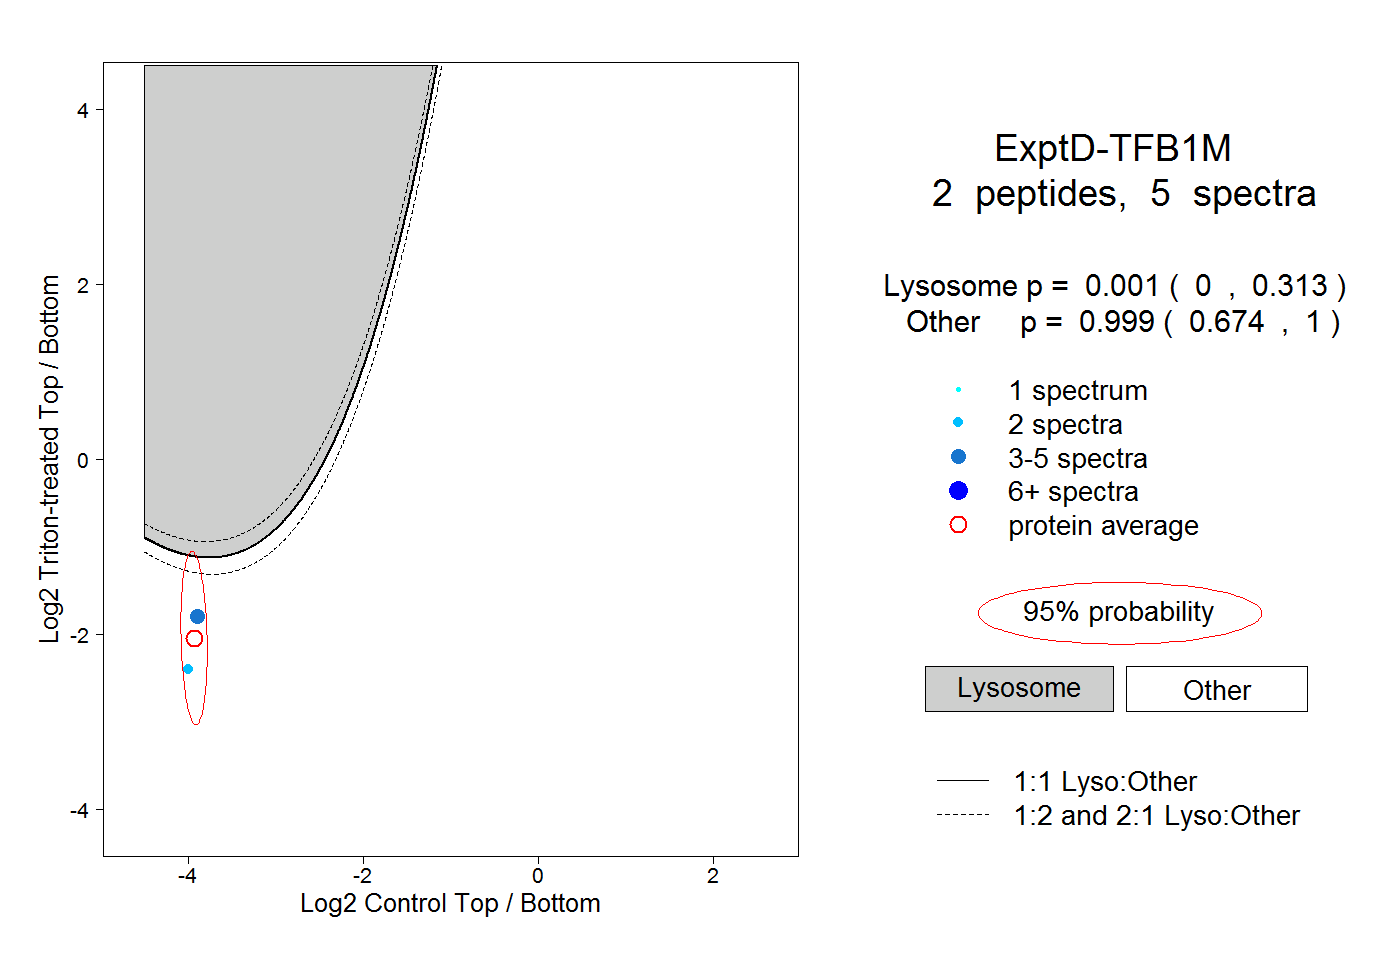 |
0.001 0.000 | 0.313 |
0.999 0.674 | 1.000 |