 7
7peptides
spectra
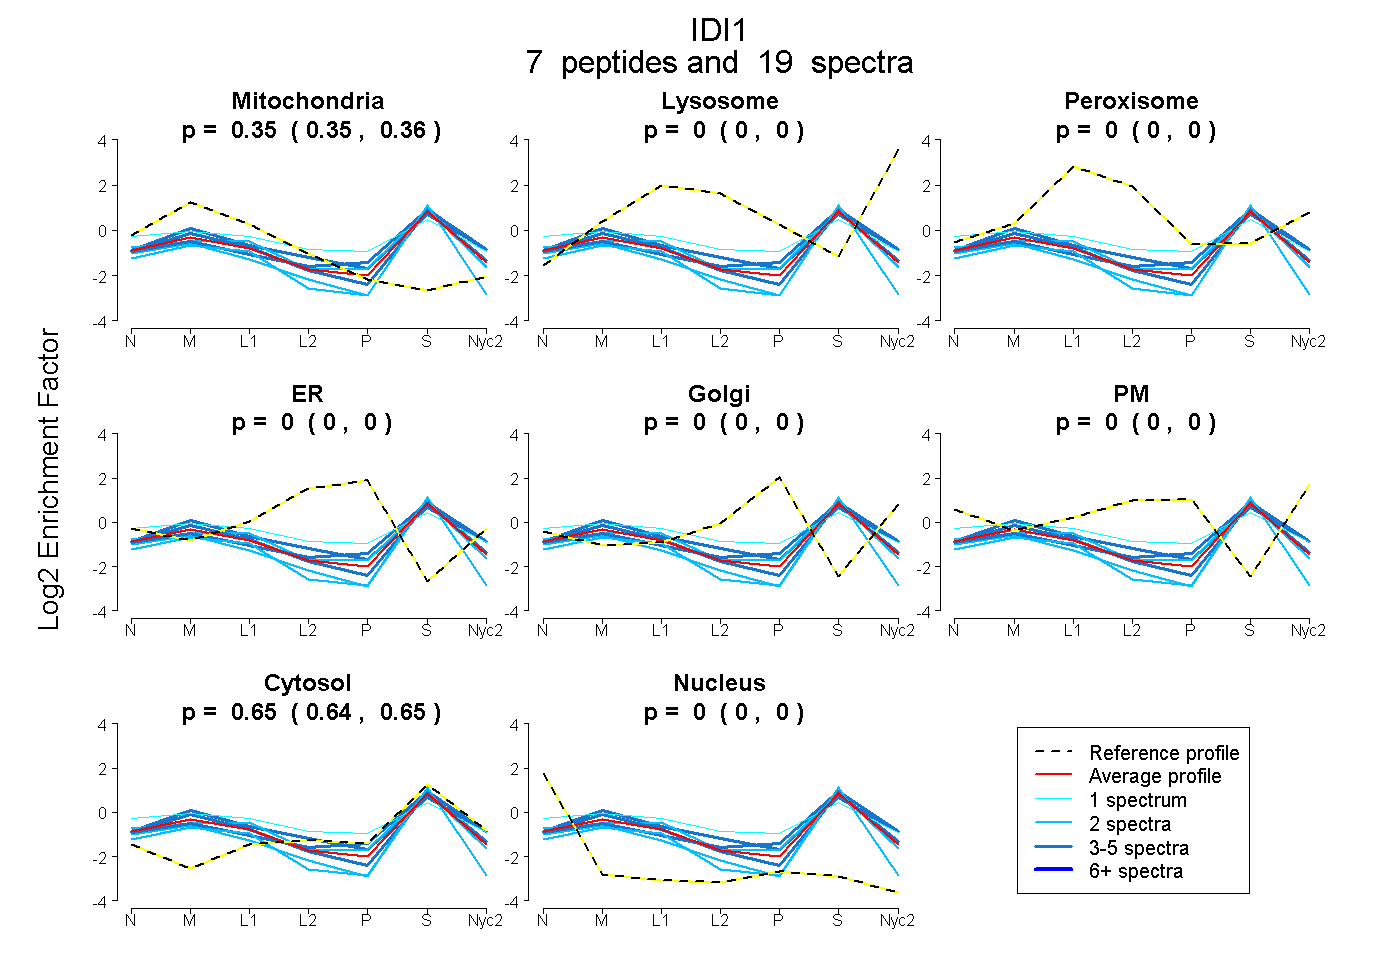
0.346 | 0.362
0.000 | 0.000
0.000 | 0.000
0.000 | 0.000
0.000 | 0.000
0.000 | 0.000
0.637 | 0.652
0.000 | 0.000
5peptides
spectra
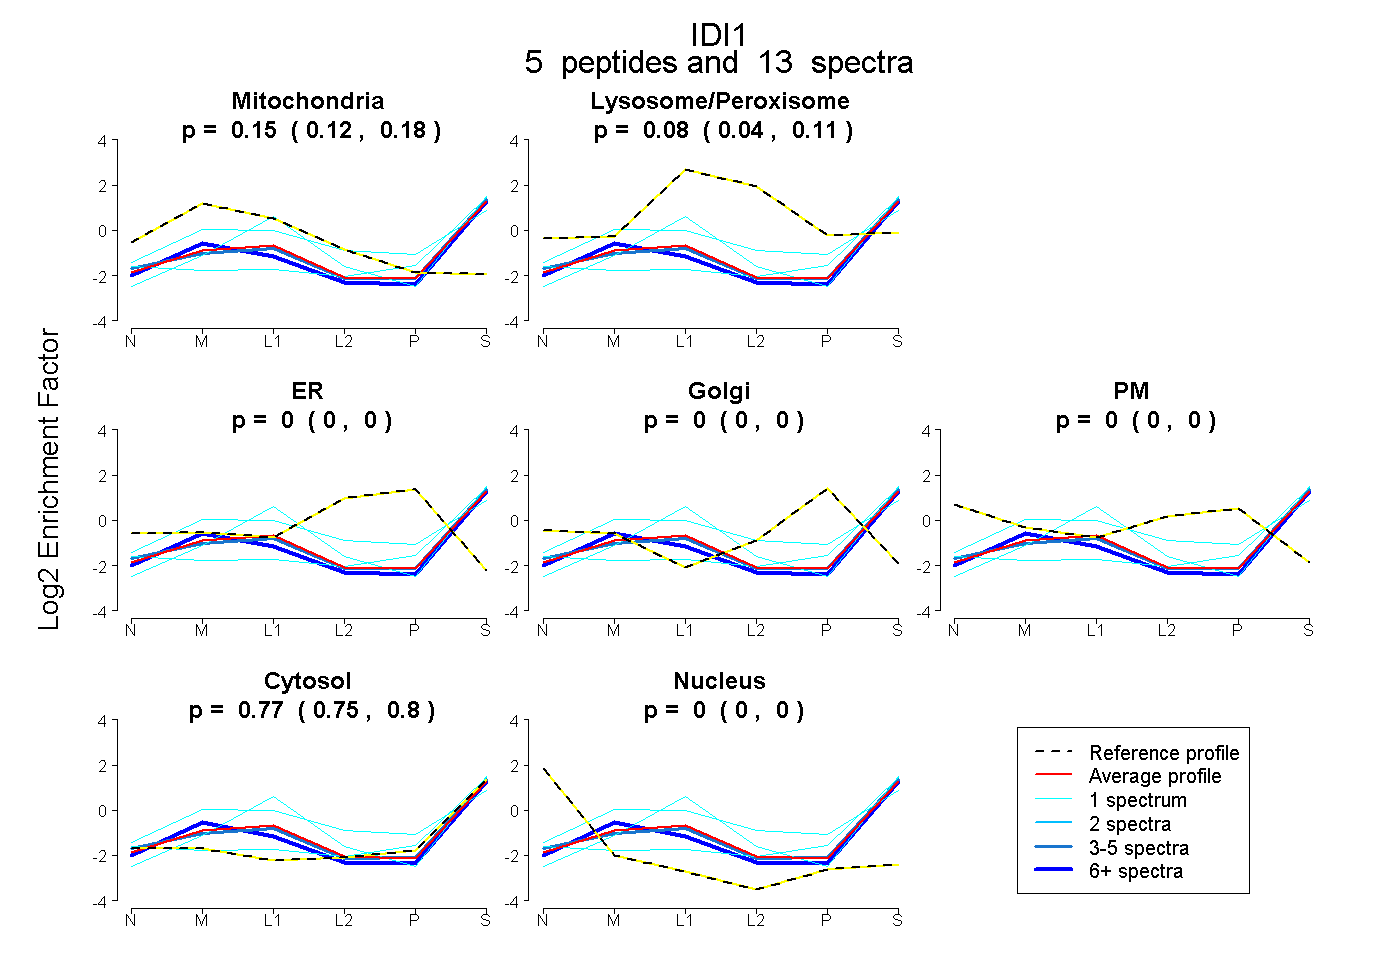
0.119 | 0.178
0.041 | 0.106
0.000 | 0.000
0.000 | 0.000
0.000 | 0.000
0.746 | 0.797
0.000 | 0.000
5peptides
spectra
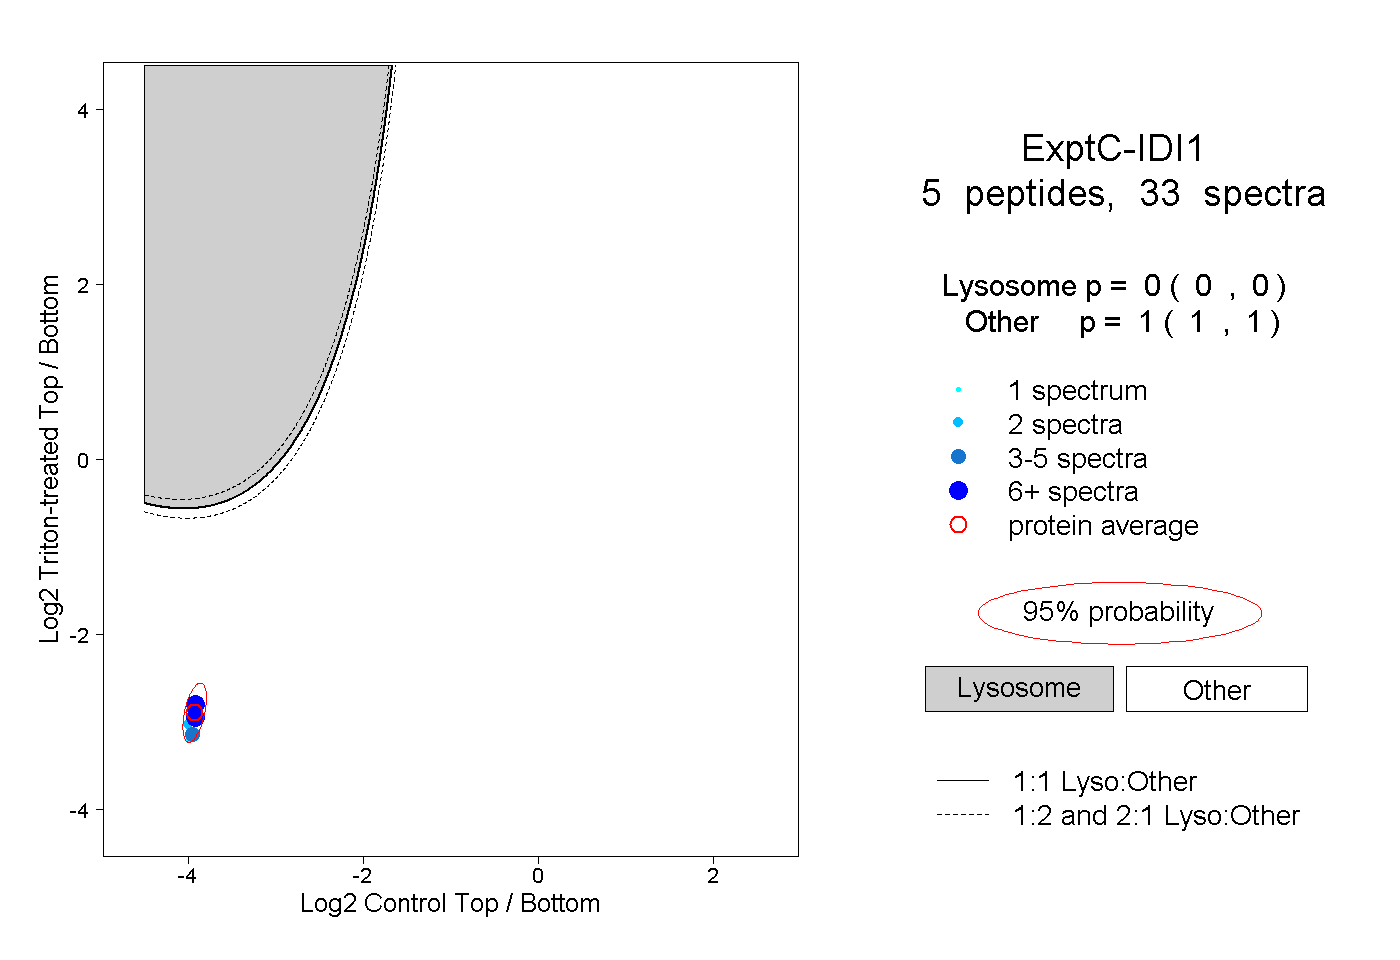
0.000 | 0.000
1.000 | 1.000
2peptides
spectra
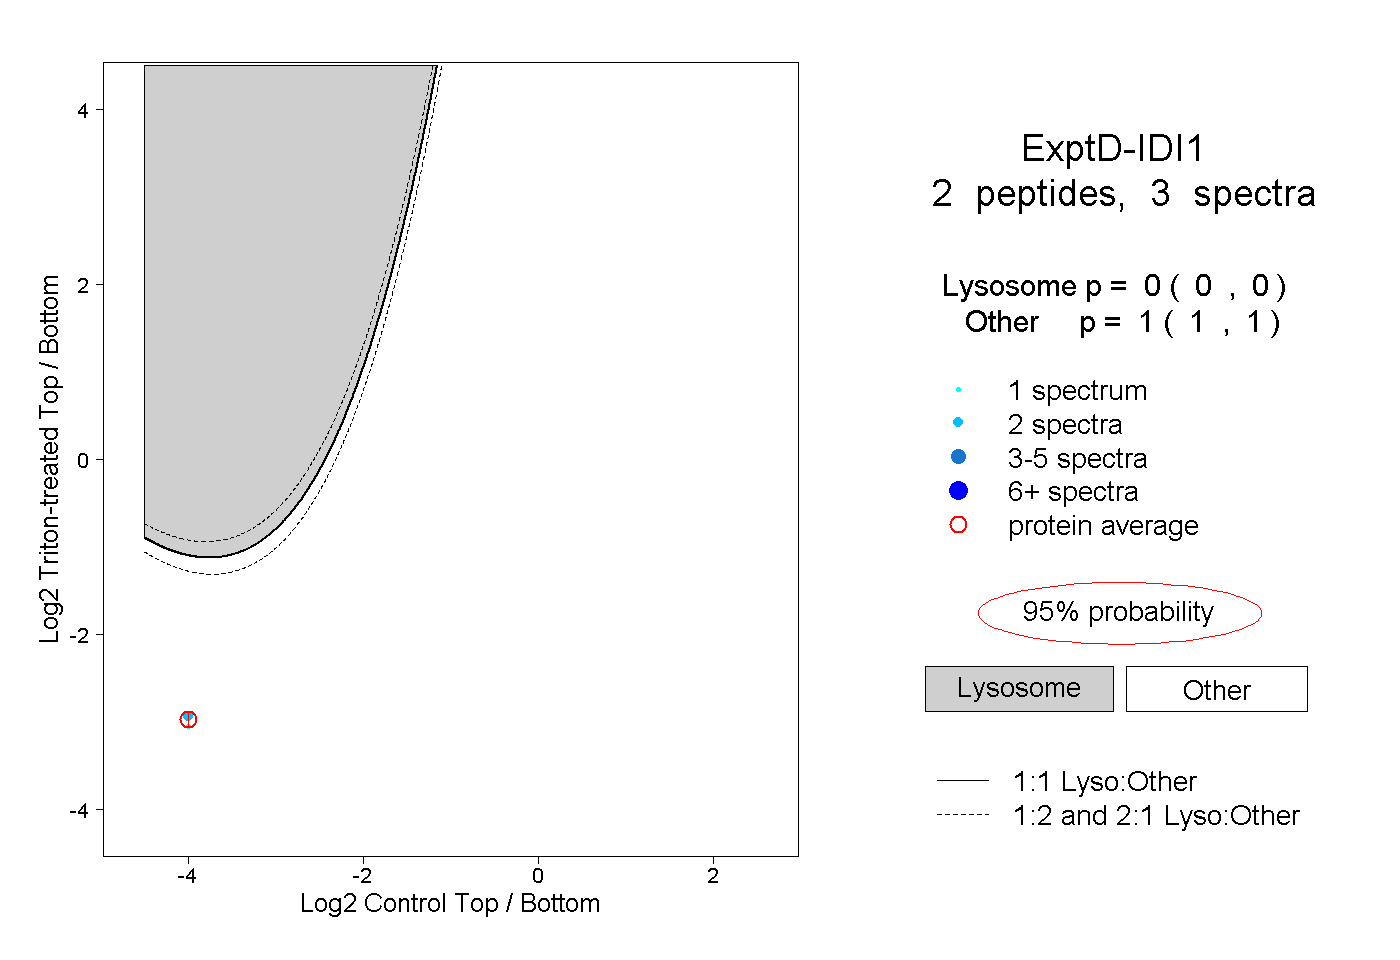
0.000 | 0.000
1.000 | 1.000